| __timestamp | Avery Dennison Corporation | Global Payments Inc. |
|---|---|---|
| Wednesday, January 1, 2014 | 1155300000 | 1295014000 |
| Thursday, January 1, 2015 | 1108100000 | 1325567000 |
| Friday, January 1, 2016 | 1097500000 | 1411096000 |
| Sunday, January 1, 2017 | 1123200000 | 1488258000 |
| Monday, January 1, 2018 | 1127500000 | 1534297000 |
| Tuesday, January 1, 2019 | 1080400000 | 2046672000 |
| Wednesday, January 1, 2020 | 1060500000 | 2878878000 |
| Friday, January 1, 2021 | 1248500000 | 3391161000 |
| Saturday, January 1, 2022 | 1330800000 | 3524578000 |
| Sunday, January 1, 2023 | 1177900000 | 4073768000 |
| Monday, January 1, 2024 | 1415300000 | 4285307000 |
Cracking the code
In the ever-evolving landscape of corporate finance, understanding the trends in Selling, General, and Administrative (SG&A) expenses is crucial. Over the past decade, Global Payments Inc. and Avery Dennison Corporation have showcased contrasting trajectories in their SG&A expenditures.
From 2014 to 2023, Global Payments Inc. has seen a staggering 214% increase in SG&A expenses, peaking at approximately $4.07 billion in 2023. This growth reflects the company's aggressive expansion and investment strategies. In contrast, Avery Dennison Corporation's SG&A expenses have remained relatively stable, with a modest 2% increase over the same period, reaching around $1.18 billion in 2023.
These trends highlight differing corporate strategies: Global Payments Inc.'s focus on scaling operations versus Avery Dennison's emphasis on efficiency. Investors and analysts should consider these insights when evaluating the financial health and strategic direction of these companies.
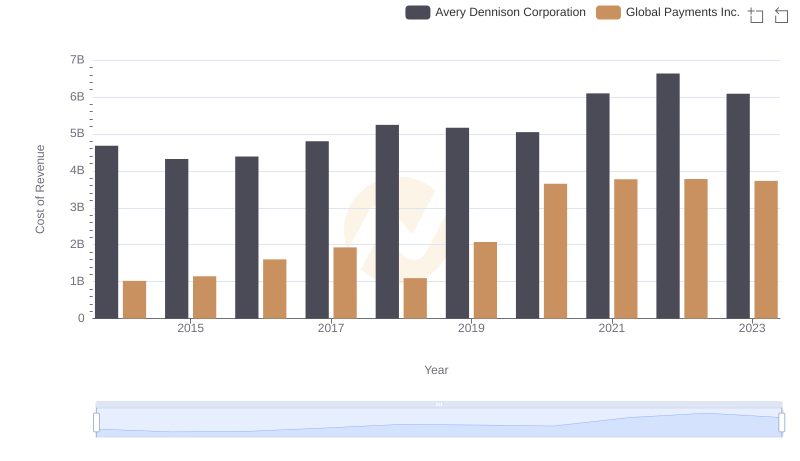
Cost of Revenue Comparison: Global Payments Inc. vs Avery Dennison Corporation
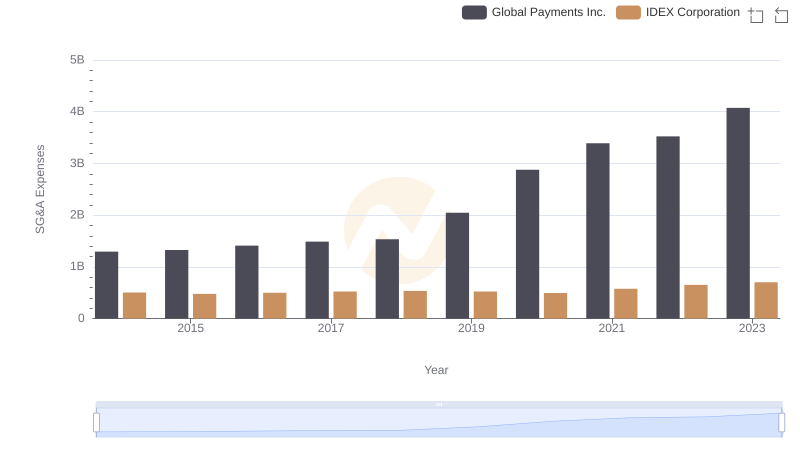
Who Optimizes SG&A Costs Better? Global Payments Inc. or IDEX Corporation
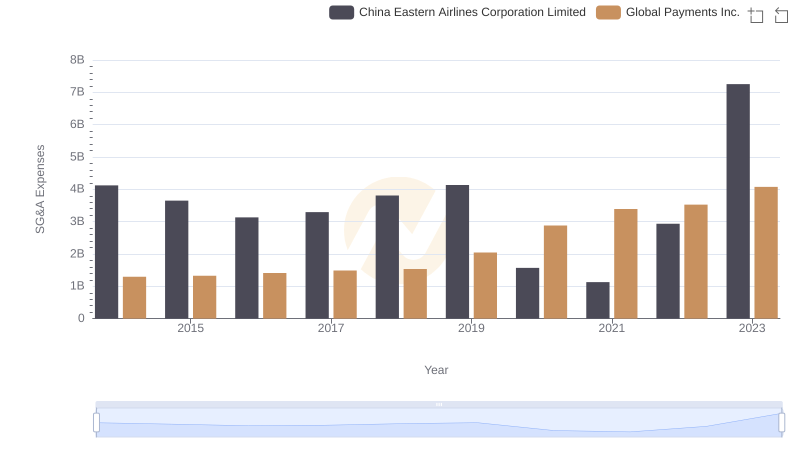
Global Payments Inc. vs China Eastern Airlines Corporation Limited: SG&A Expense Trends
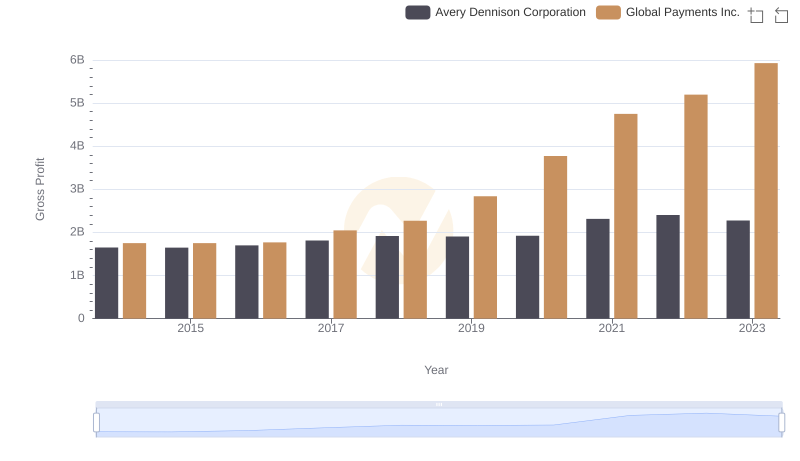
Global Payments Inc. vs Avery Dennison Corporation: A Gross Profit Performance Breakdown
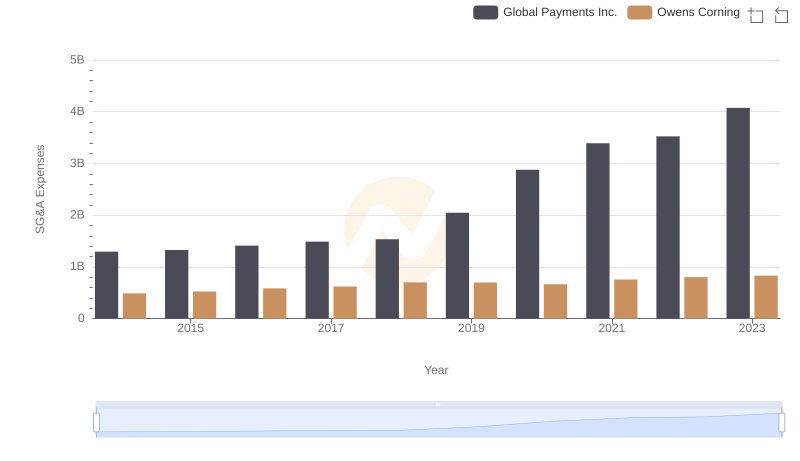
Global Payments Inc. and Owens Corning: SG&A Spending Patterns Compared
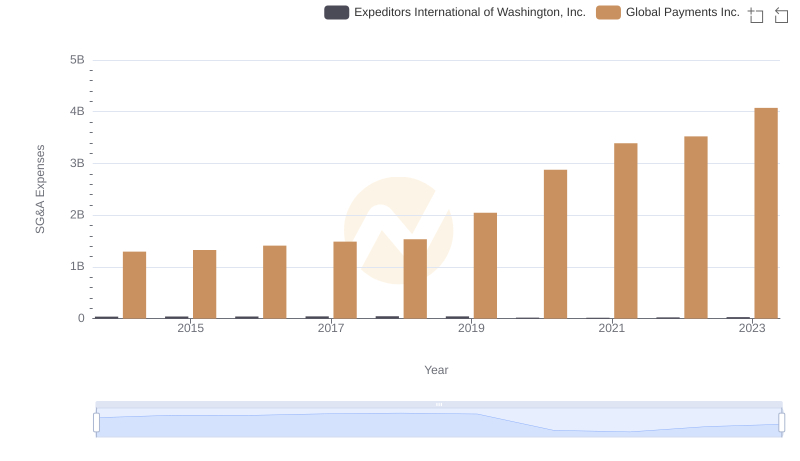
Breaking Down SG&A Expenses: Global Payments Inc. vs Expeditors International of Washington, Inc.
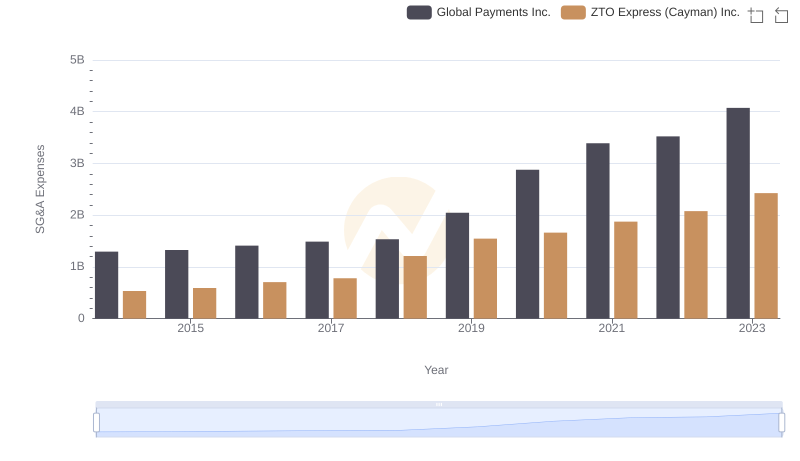
Selling, General, and Administrative Costs: Global Payments Inc. vs ZTO Express (Cayman) Inc.
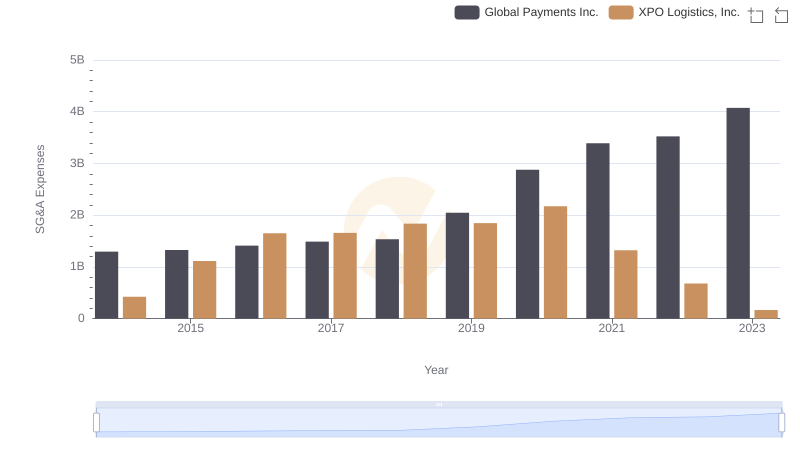
SG&A Efficiency Analysis: Comparing Global Payments Inc. and XPO Logistics, Inc.
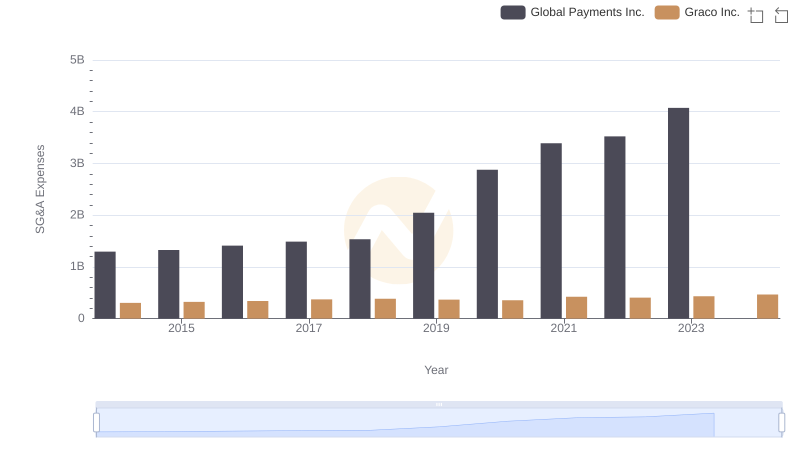
Global Payments Inc. vs Graco Inc.: SG&A Expense Trends
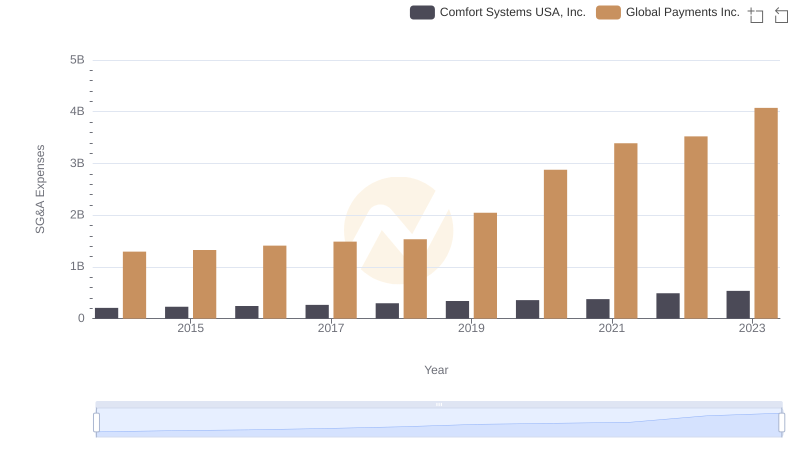
Selling, General, and Administrative Costs: Global Payments Inc. vs Comfort Systems USA, Inc.