| __timestamp | China Eastern Airlines Corporation Limited | Global Payments Inc. |
|---|---|---|
| Wednesday, January 1, 2014 | 4120000000 | 1295014000 |
| Thursday, January 1, 2015 | 3651000000 | 1325567000 |
| Friday, January 1, 2016 | 3133000000 | 1411096000 |
| Sunday, January 1, 2017 | 3294000000 | 1488258000 |
| Monday, January 1, 2018 | 3807000000 | 1534297000 |
| Tuesday, January 1, 2019 | 4134000000 | 2046672000 |
| Wednesday, January 1, 2020 | 1570000000 | 2878878000 |
| Friday, January 1, 2021 | 1128000000 | 3391161000 |
| Saturday, January 1, 2022 | 2933000000 | 3524578000 |
| Sunday, January 1, 2023 | 7254000000 | 4073768000 |
| Monday, January 1, 2024 | 4285307000 |
Cracking the code
In the ever-evolving landscape of global commerce, the Selling, General, and Administrative (SG&A) expenses of companies offer a window into their operational strategies. Over the past decade, Global Payments Inc. and China Eastern Airlines Corporation Limited have showcased contrasting trends in their SG&A expenses.
From 2014 to 2023, China Eastern Airlines experienced a rollercoaster in SG&A expenses, peaking in 2023 with a staggering 107% increase from its 2020 low. This surge reflects the airline's strategic investments in post-pandemic recovery and expansion. In contrast, Global Payments Inc. demonstrated a steady upward trajectory, with a 214% rise over the same period, highlighting its aggressive growth and market penetration strategies.
These trends underscore the dynamic nature of corporate strategies in response to global economic shifts. As businesses navigate the complexities of the modern market, understanding these expense patterns is crucial for investors and analysts alike.
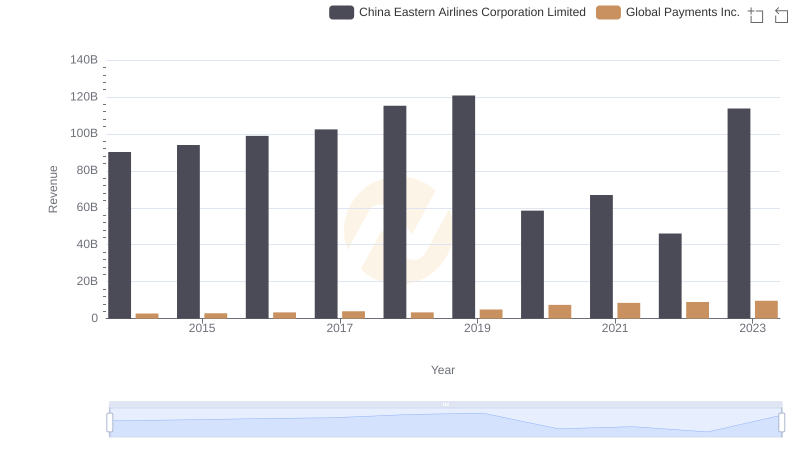
Who Generates More Revenue? Global Payments Inc. or China Eastern Airlines Corporation Limited
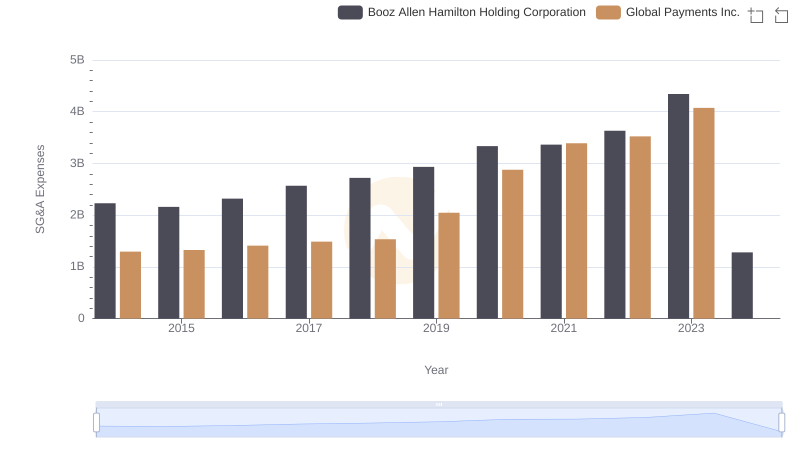
Who Optimizes SG&A Costs Better? Global Payments Inc. or Booz Allen Hamilton Holding Corporation
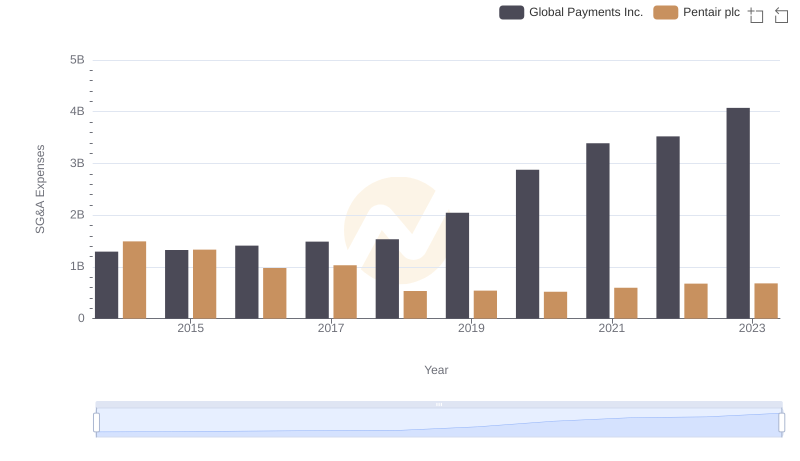
Selling, General, and Administrative Costs: Global Payments Inc. vs Pentair plc
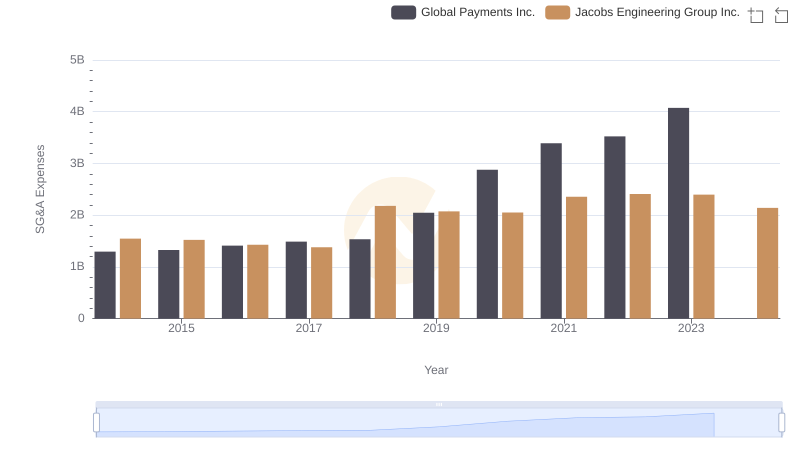
Cost Management Insights: SG&A Expenses for Global Payments Inc. and Jacobs Engineering Group Inc.
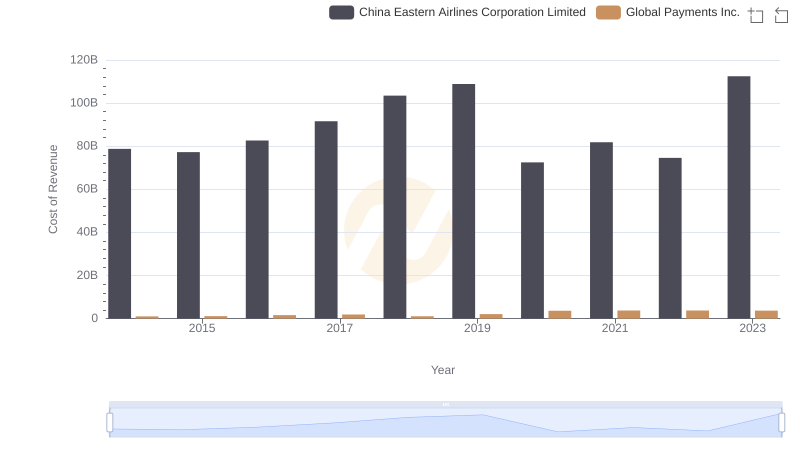
Cost of Revenue Trends: Global Payments Inc. vs China Eastern Airlines Corporation Limited
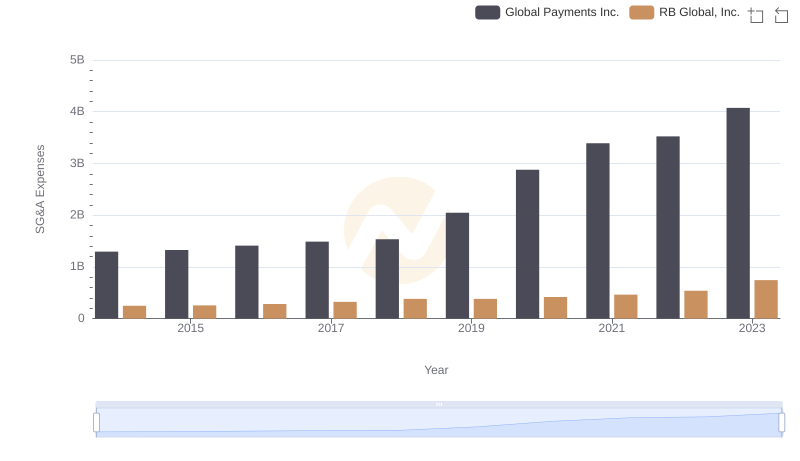
Cost Management Insights: SG&A Expenses for Global Payments Inc. and RB Global, Inc.
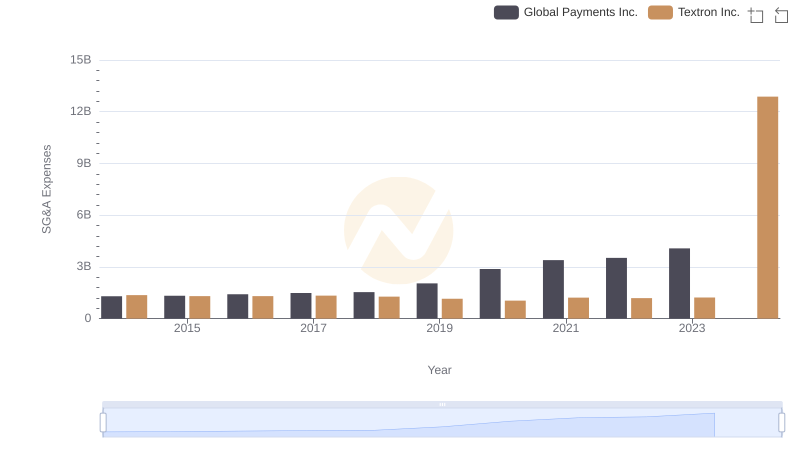
Cost Management Insights: SG&A Expenses for Global Payments Inc. and Textron Inc.
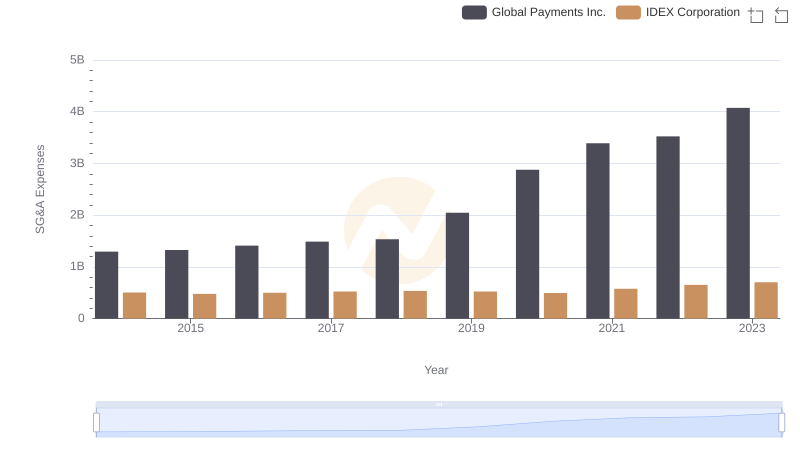
Who Optimizes SG&A Costs Better? Global Payments Inc. or IDEX Corporation
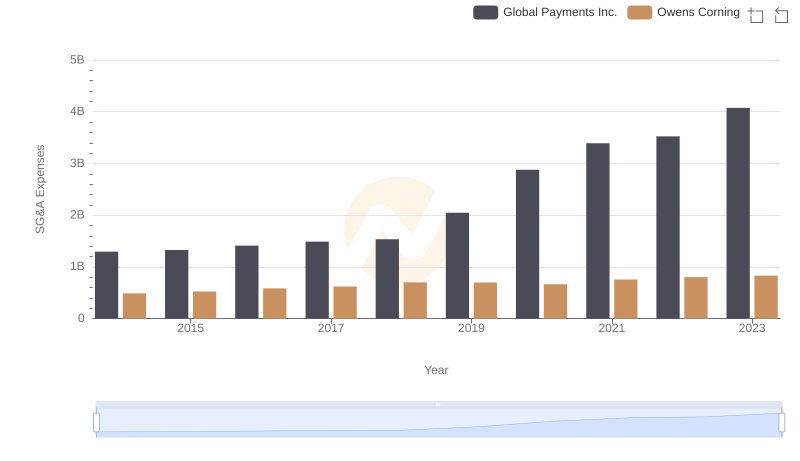
Global Payments Inc. and Owens Corning: SG&A Spending Patterns Compared
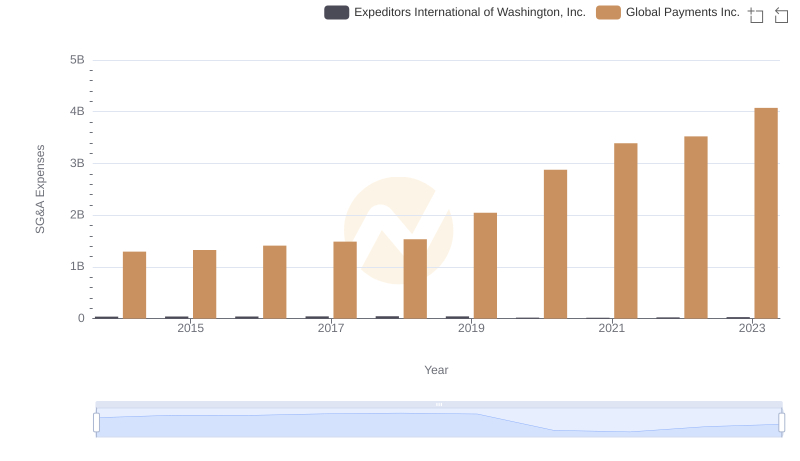
Breaking Down SG&A Expenses: Global Payments Inc. vs Expeditors International of Washington, Inc.
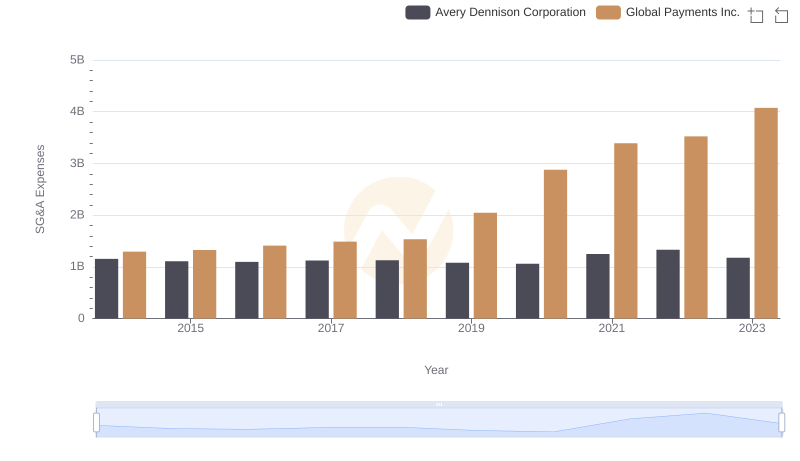
Comparing SG&A Expenses: Global Payments Inc. vs Avery Dennison Corporation Trends and Insights
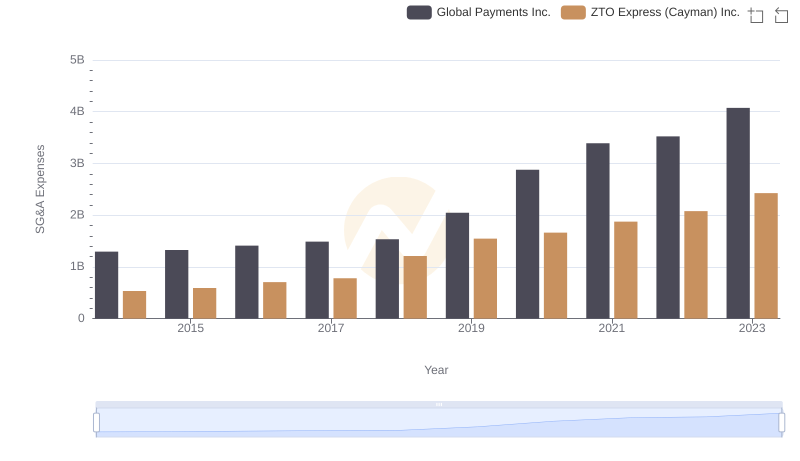
Selling, General, and Administrative Costs: Global Payments Inc. vs ZTO Express (Cayman) Inc.