| __timestamp | EMCOR Group, Inc. | Masco Corporation |
|---|---|---|
| Wednesday, January 1, 2014 | 6424965000 | 8521000000 |
| Thursday, January 1, 2015 | 6718726000 | 7142000000 |
| Friday, January 1, 2016 | 7551524000 | 7357000000 |
| Sunday, January 1, 2017 | 7686999000 | 7644000000 |
| Monday, January 1, 2018 | 8130631000 | 8359000000 |
| Tuesday, January 1, 2019 | 9174611000 | 6707000000 |
| Wednesday, January 1, 2020 | 8797061000 | 7188000000 |
| Friday, January 1, 2021 | 9903580000 | 8375000000 |
| Saturday, January 1, 2022 | 11076120000 | 8680000000 |
| Sunday, January 1, 2023 | 12582873000 | 7967000000 |
| Monday, January 1, 2024 | 7828000000 |
In pursuit of knowledge
In the ever-evolving landscape of the construction and home improvement sectors, EMCOR Group, Inc. and Masco Corporation have emerged as key players. Over the past decade, EMCOR has demonstrated a robust growth trajectory, with its revenue surging by nearly 96% from 2014 to 2023. This impressive growth reflects EMCOR's strategic expansions and market adaptability. In contrast, Masco Corporation, while maintaining a steady presence, experienced a more modest revenue increase of approximately 6% over the same period. Notably, EMCOR's revenue surpassed Masco's in 2019, marking a pivotal shift in market dynamics. The data highlights EMCOR's resilience and strategic prowess, while Masco's consistent performance underscores its stability in a competitive market. As we look to the future, these trends offer valuable insights into the strategic directions and market positions of these industry giants.
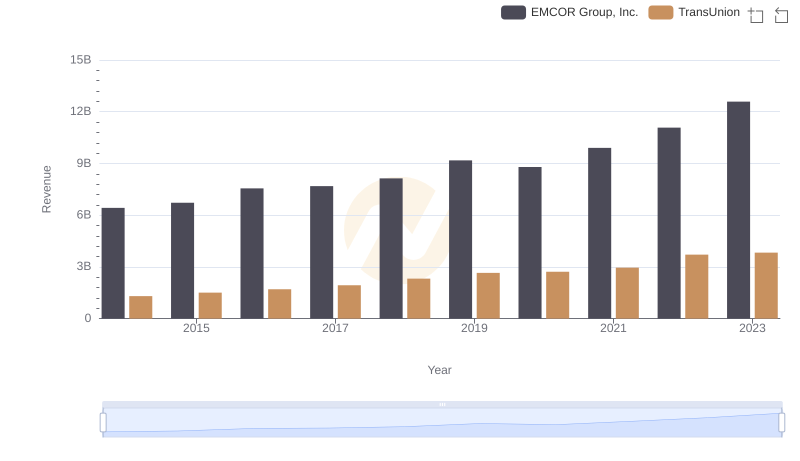
Revenue Insights: EMCOR Group, Inc. and TransUnion Performance Compared
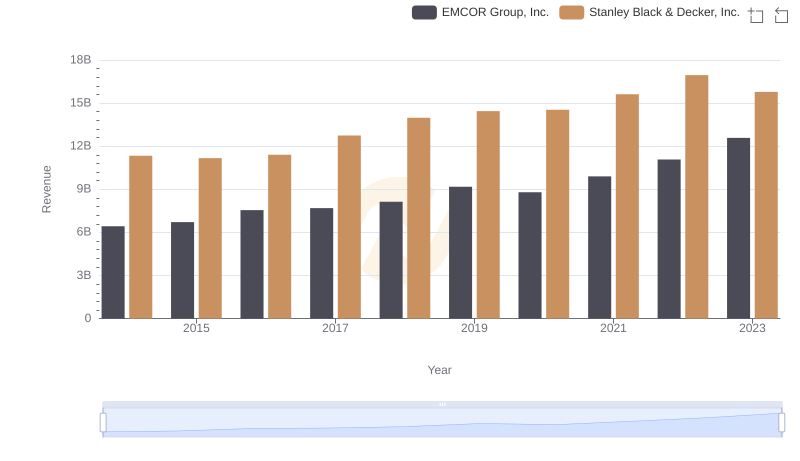
Annual Revenue Comparison: EMCOR Group, Inc. vs Stanley Black & Decker, Inc.
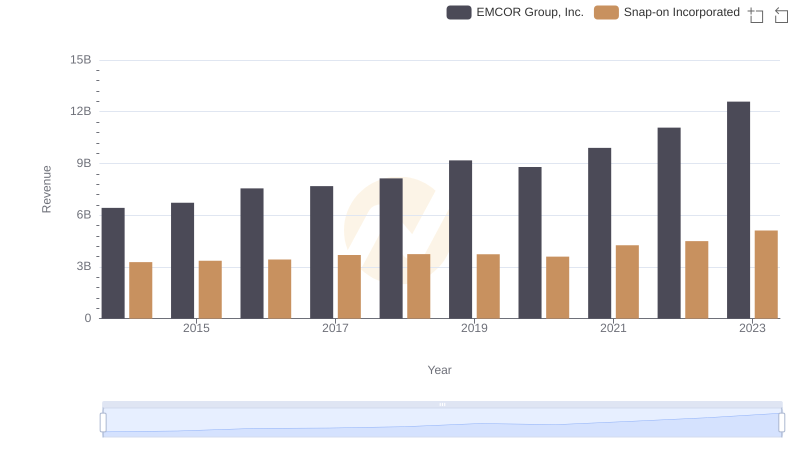
Annual Revenue Comparison: EMCOR Group, Inc. vs Snap-on Incorporated
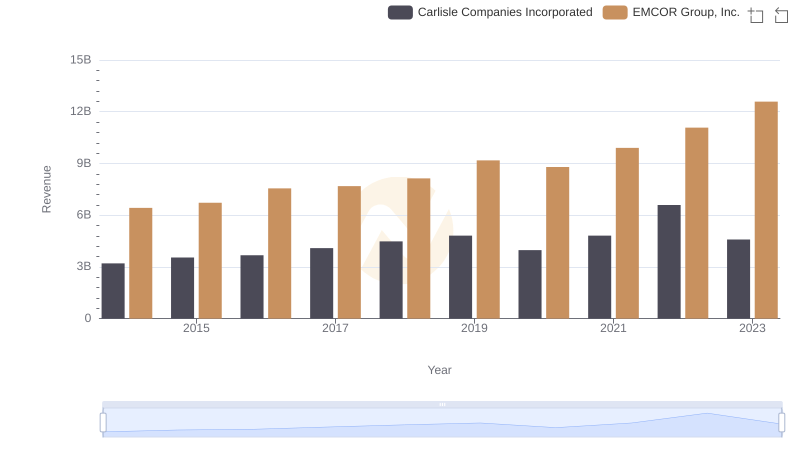
EMCOR Group, Inc. or Carlisle Companies Incorporated: Who Leads in Yearly Revenue?
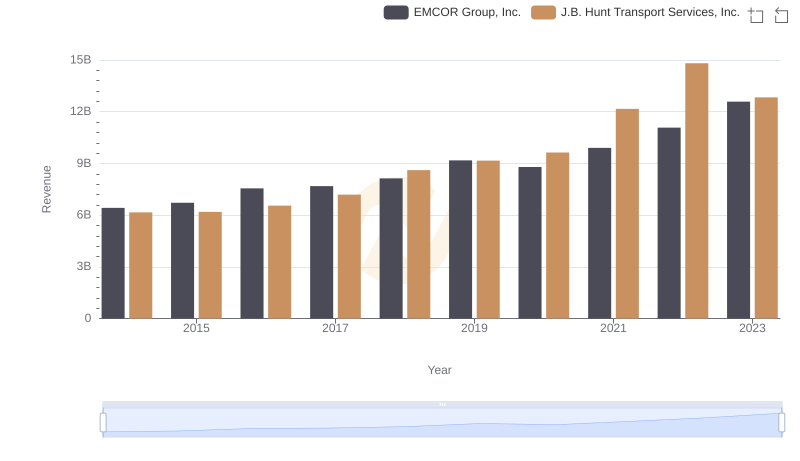
Annual Revenue Comparison: EMCOR Group, Inc. vs J.B. Hunt Transport Services, Inc.
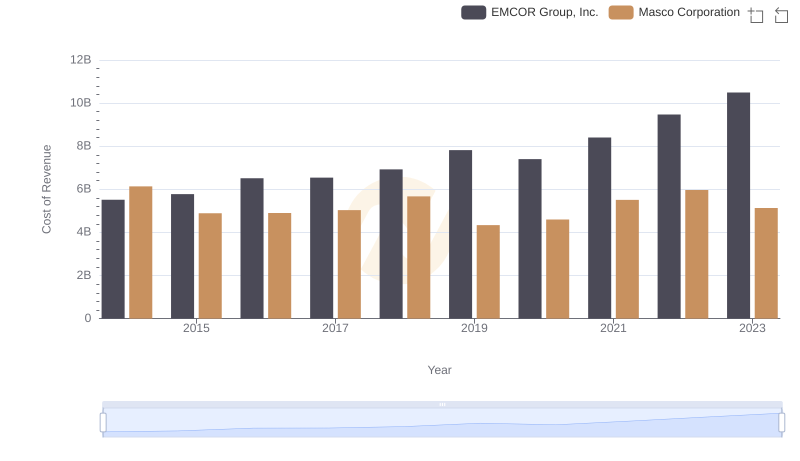
Cost of Revenue: Key Insights for EMCOR Group, Inc. and Masco Corporation
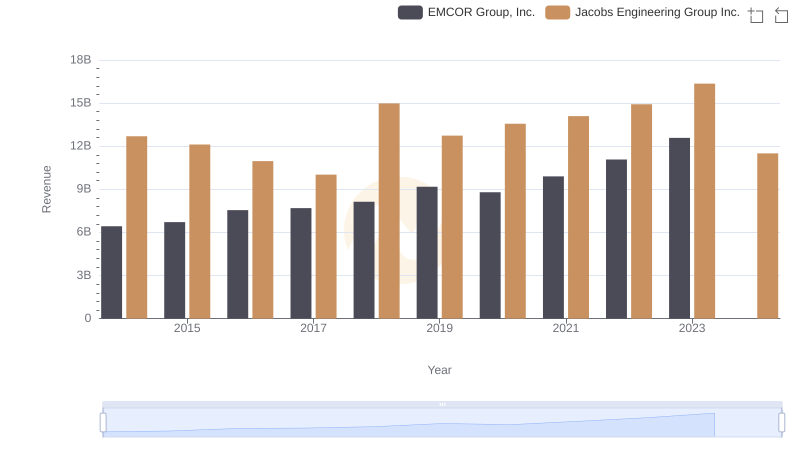
EMCOR Group, Inc. vs Jacobs Engineering Group Inc.: Examining Key Revenue Metrics
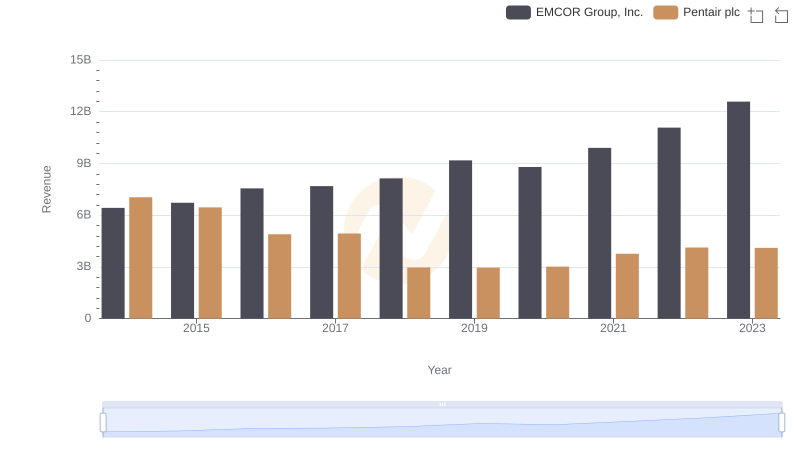
Revenue Insights: EMCOR Group, Inc. and Pentair plc Performance Compared
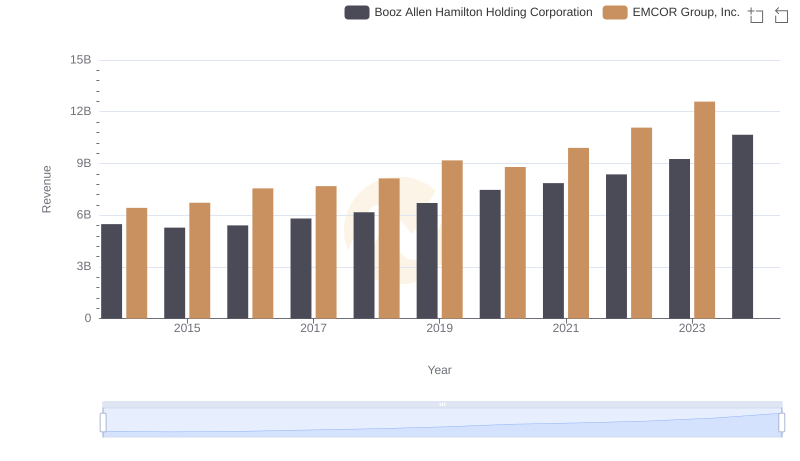
Revenue Insights: EMCOR Group, Inc. and Booz Allen Hamilton Holding Corporation Performance Compared
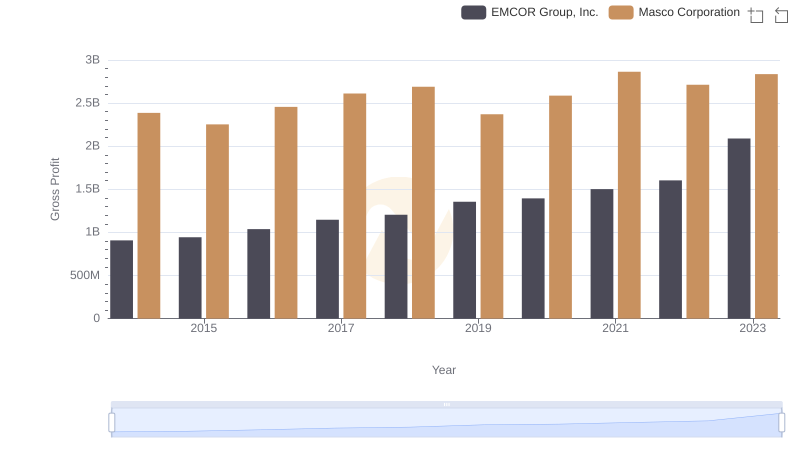
Gross Profit Trends Compared: EMCOR Group, Inc. vs Masco Corporation
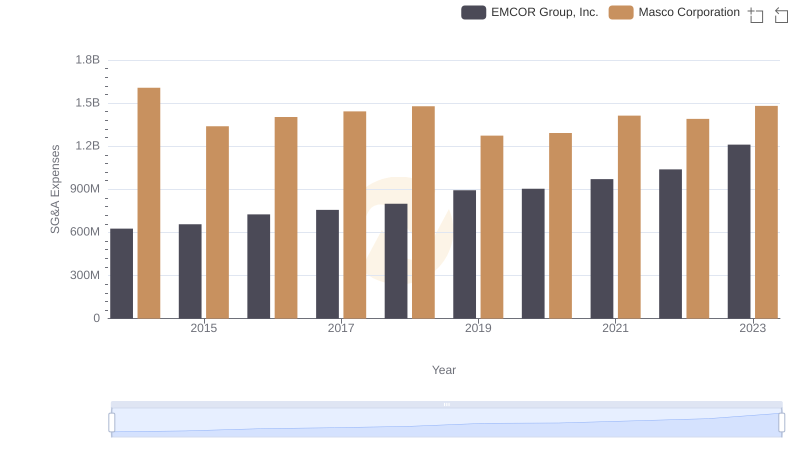
SG&A Efficiency Analysis: Comparing EMCOR Group, Inc. and Masco Corporation
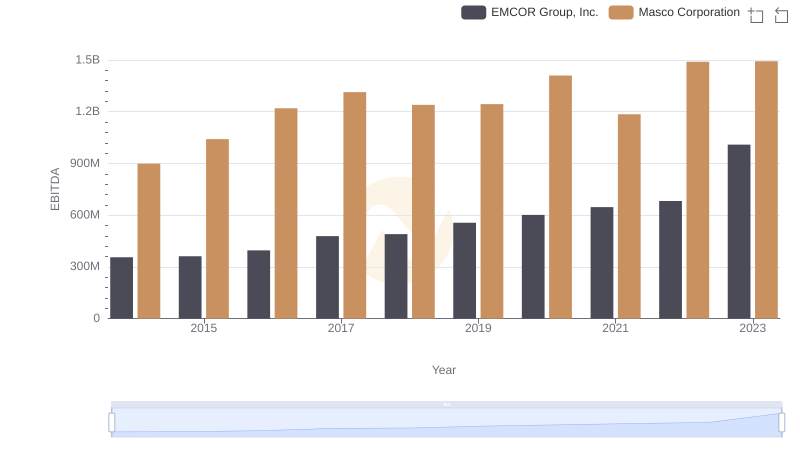
Professional EBITDA Benchmarking: EMCOR Group, Inc. vs Masco Corporation