| __timestamp | EMCOR Group, Inc. | Pentair plc |
|---|---|---|
| Wednesday, January 1, 2014 | 6424965000 | 7039000000 |
| Thursday, January 1, 2015 | 6718726000 | 6449000000 |
| Friday, January 1, 2016 | 7551524000 | 4890000000 |
| Sunday, January 1, 2017 | 7686999000 | 4936500000 |
| Monday, January 1, 2018 | 8130631000 | 2965100000 |
| Tuesday, January 1, 2019 | 9174611000 | 2957200000 |
| Wednesday, January 1, 2020 | 8797061000 | 3017800000 |
| Friday, January 1, 2021 | 9903580000 | 3764800000 |
| Saturday, January 1, 2022 | 11076120000 | 4121800000 |
| Sunday, January 1, 2023 | 12582873000 | 4104500000 |
| Monday, January 1, 2024 | 4082800000 |
Cracking the code
In the competitive landscape of industrial services and water solutions, EMCOR Group, Inc. and Pentair plc have showcased contrasting revenue trajectories over the past decade. From 2014 to 2023, EMCOR Group, Inc. has experienced a robust revenue growth of approximately 96%, starting from $6.4 billion and reaching $12.6 billion. This impressive growth highlights EMCOR's strategic expansion and market adaptability.
Conversely, Pentair plc has faced a challenging period, with revenues declining by about 42% from $7 billion in 2014 to $4.1 billion in 2023. This decline reflects the company's struggle to maintain its market share amidst evolving industry dynamics.
The data underscores EMCOR's consistent upward trend, while Pentair's revenue fluctuations suggest a need for strategic realignment. As the industrial sector continues to evolve, these insights provide a valuable perspective on the financial health and strategic direction of these two industry players.
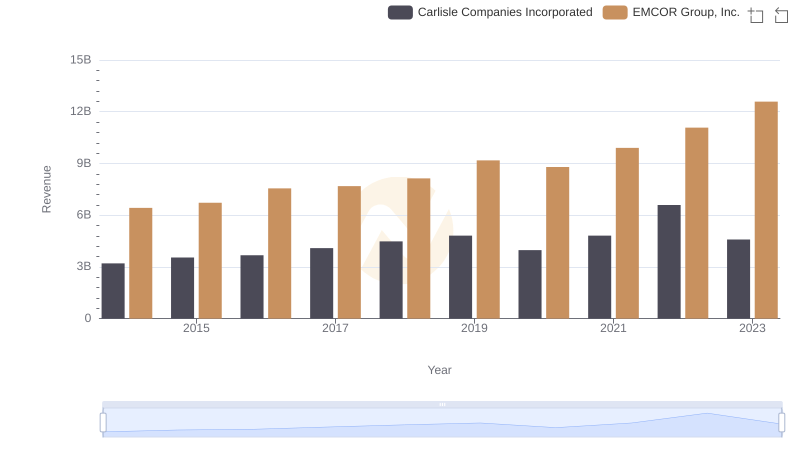
EMCOR Group, Inc. or Carlisle Companies Incorporated: Who Leads in Yearly Revenue?
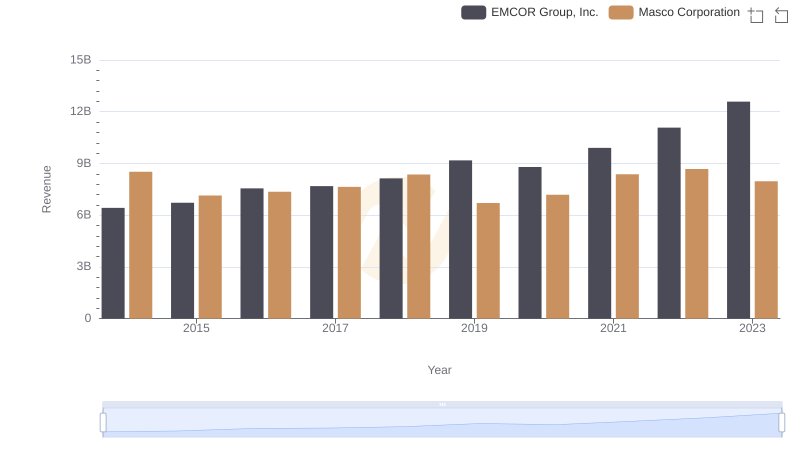
EMCOR Group, Inc. and Masco Corporation: A Comprehensive Revenue Analysis
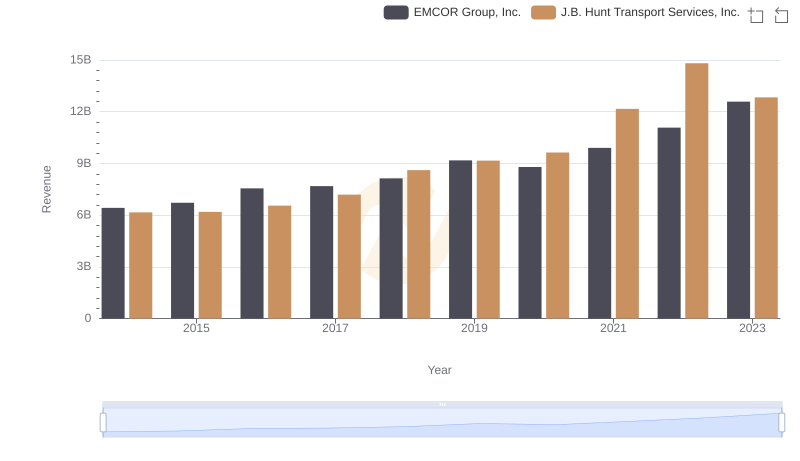
Annual Revenue Comparison: EMCOR Group, Inc. vs J.B. Hunt Transport Services, Inc.
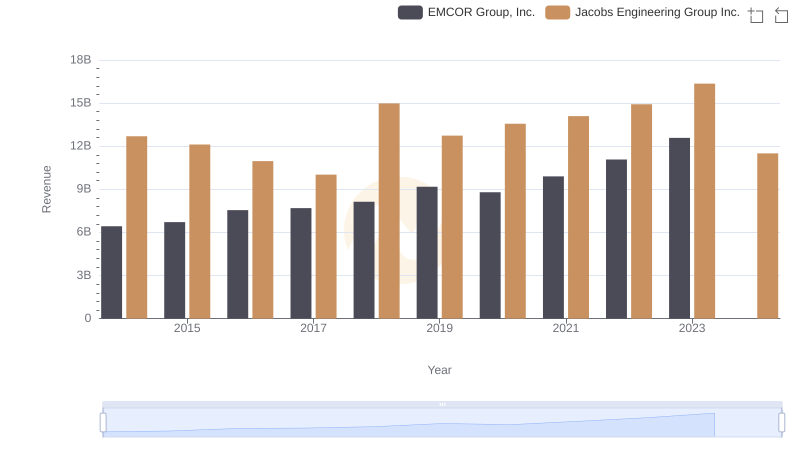
EMCOR Group, Inc. vs Jacobs Engineering Group Inc.: Examining Key Revenue Metrics
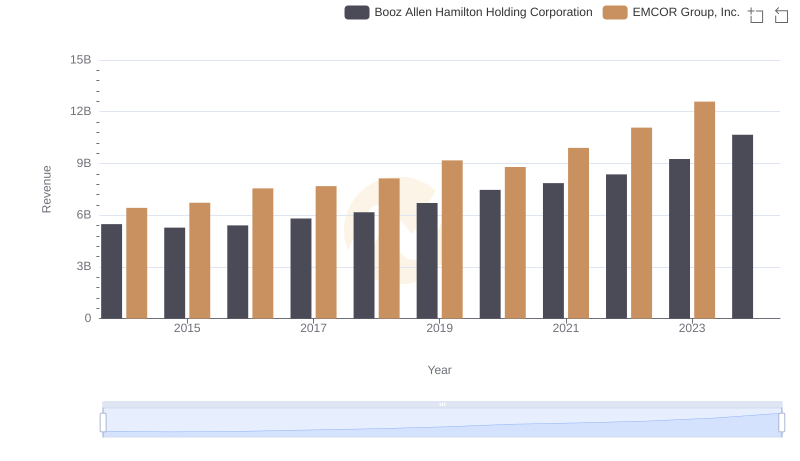
Revenue Insights: EMCOR Group, Inc. and Booz Allen Hamilton Holding Corporation Performance Compared
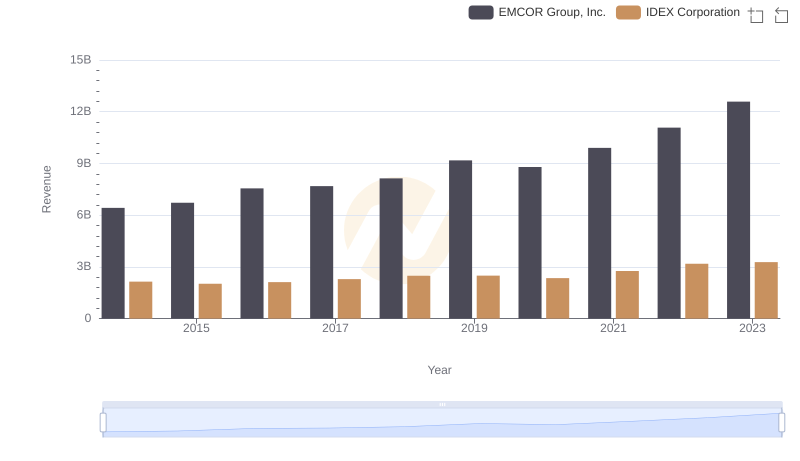
Comparing Revenue Performance: EMCOR Group, Inc. or IDEX Corporation?
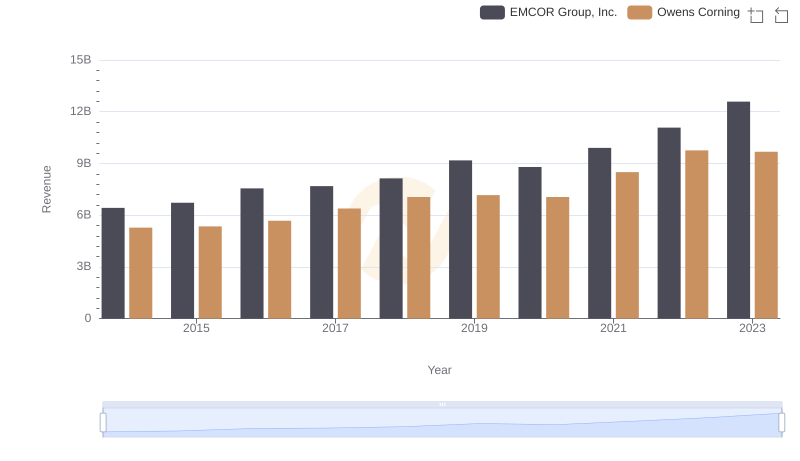
EMCOR Group, Inc. vs Owens Corning: Examining Key Revenue Metrics
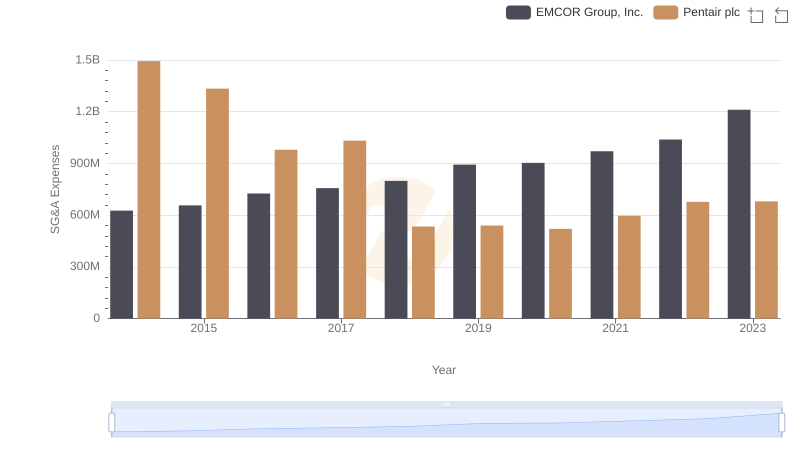
EMCOR Group, Inc. and Pentair plc: SG&A Spending Patterns Compared
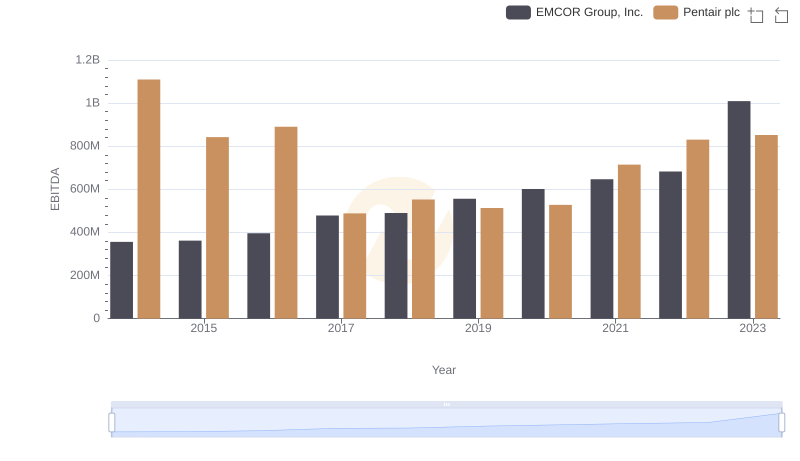
EBITDA Analysis: Evaluating EMCOR Group, Inc. Against Pentair plc