| __timestamp | EMCOR Group, Inc. | Masco Corporation |
|---|---|---|
| Wednesday, January 1, 2014 | 907246000 | 2387000000 |
| Thursday, January 1, 2015 | 944479000 | 2253000000 |
| Friday, January 1, 2016 | 1037862000 | 2456000000 |
| Sunday, January 1, 2017 | 1147012000 | 2611000000 |
| Monday, January 1, 2018 | 1205453000 | 2689000000 |
| Tuesday, January 1, 2019 | 1355868000 | 2371000000 |
| Wednesday, January 1, 2020 | 1395382000 | 2587000000 |
| Friday, January 1, 2021 | 1501737000 | 2863000000 |
| Saturday, January 1, 2022 | 1603594000 | 2713000000 |
| Sunday, January 1, 2023 | 2089339000 | 2836000000 |
| Monday, January 1, 2024 | 2831000000 |
Cracking the code
In the competitive landscape of the construction and home improvement sectors, EMCOR Group, Inc. and Masco Corporation have shown distinct trajectories in their gross profit trends from 2014 to 2023. Over this period, Masco Corporation consistently outperformed EMCOR Group, Inc., with an average gross profit nearly double that of EMCOR. However, EMCOR has demonstrated a remarkable growth rate, increasing its gross profit by approximately 130% from 2014 to 2023, compared to Masco's 19% growth. This surge is particularly notable in 2023, where EMCOR's gross profit reached its peak, closing the gap with Masco. These trends highlight EMCOR's aggressive expansion and operational efficiency, while Masco maintains its stronghold in the market. As the industry evolves, these companies' financial strategies will be crucial in shaping their future market positions.
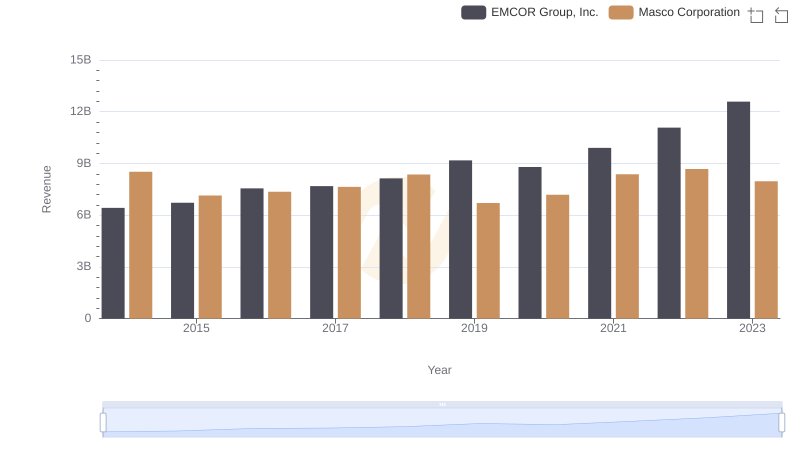
EMCOR Group, Inc. and Masco Corporation: A Comprehensive Revenue Analysis
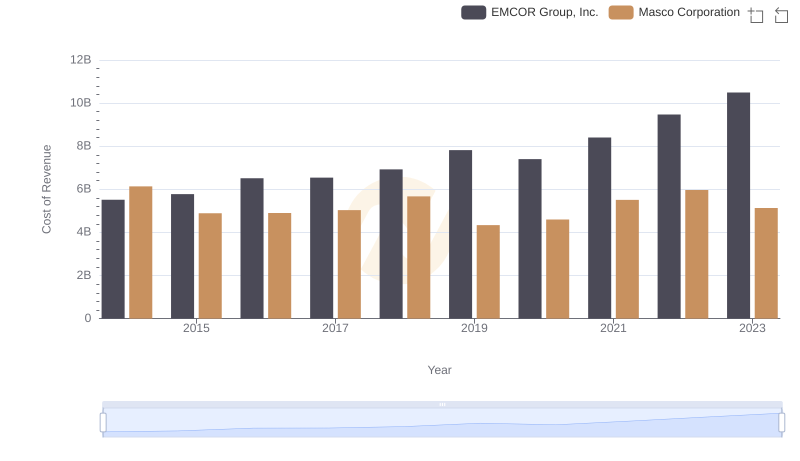
Cost of Revenue: Key Insights for EMCOR Group, Inc. and Masco Corporation
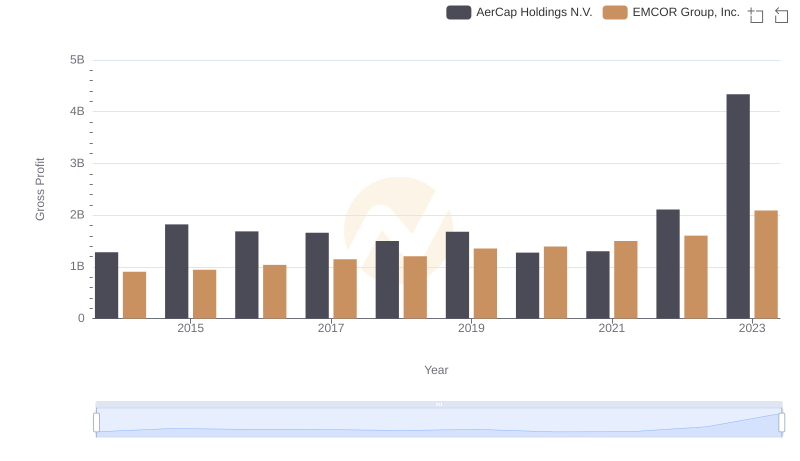
EMCOR Group, Inc. vs AerCap Holdings N.V.: A Gross Profit Performance Breakdown
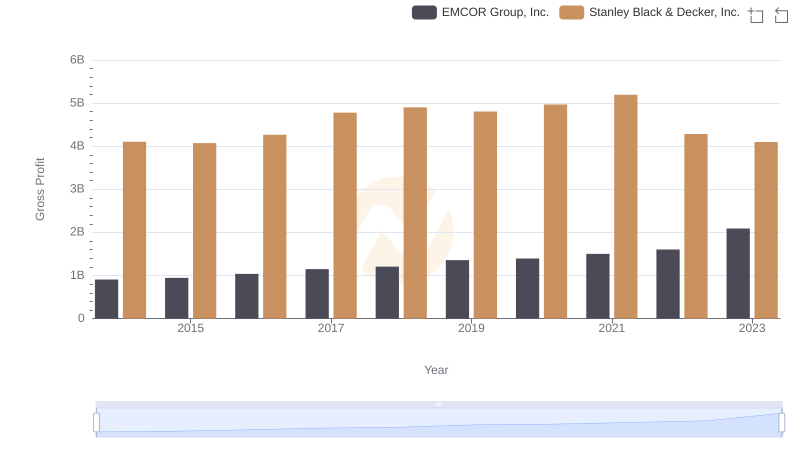
Key Insights on Gross Profit: EMCOR Group, Inc. vs Stanley Black & Decker, Inc.
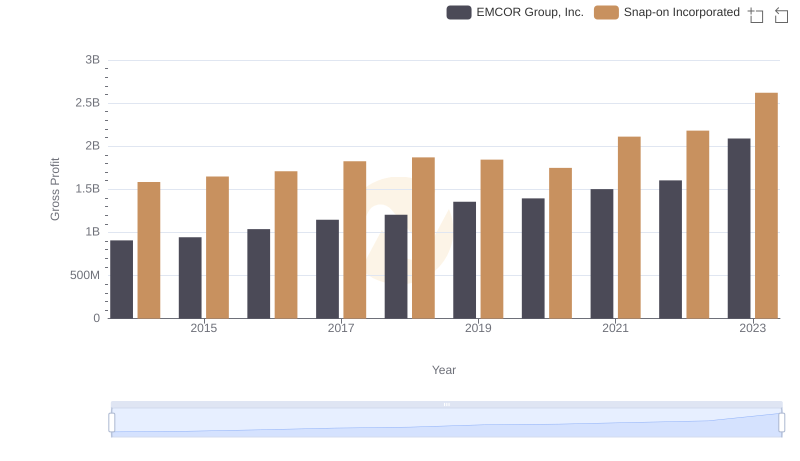
Gross Profit Comparison: EMCOR Group, Inc. and Snap-on Incorporated Trends
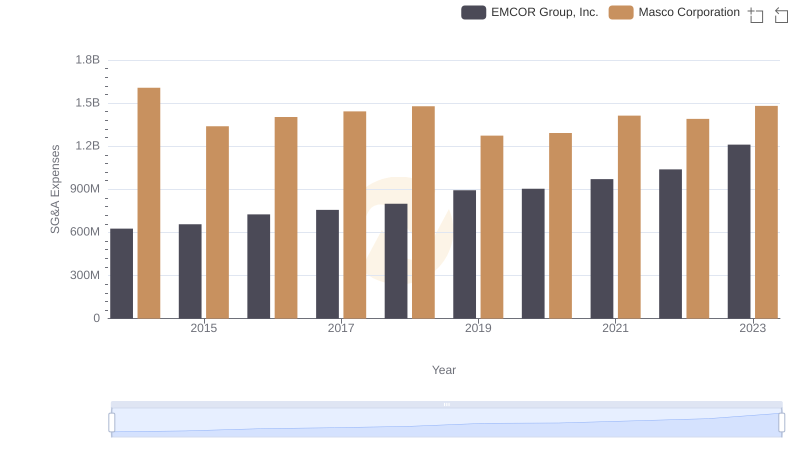
SG&A Efficiency Analysis: Comparing EMCOR Group, Inc. and Masco Corporation
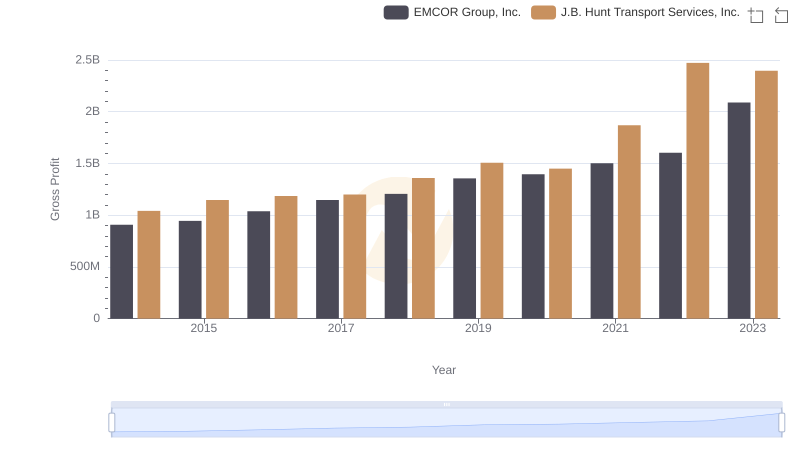
Gross Profit Trends Compared: EMCOR Group, Inc. vs J.B. Hunt Transport Services, Inc.
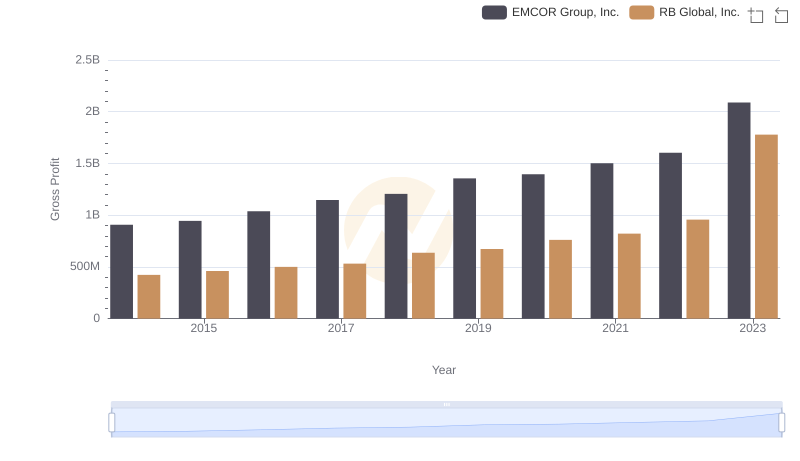
EMCOR Group, Inc. and RB Global, Inc.: A Detailed Gross Profit Analysis
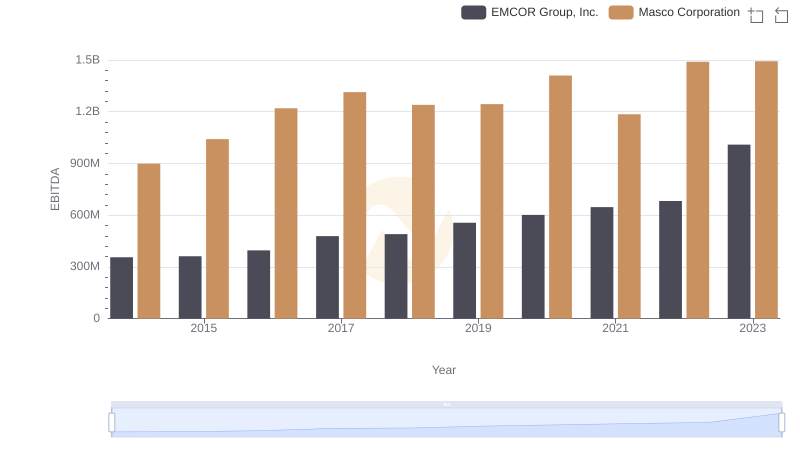
Professional EBITDA Benchmarking: EMCOR Group, Inc. vs Masco Corporation