| __timestamp | EMCOR Group, Inc. | Masco Corporation |
|---|---|---|
| Wednesday, January 1, 2014 | 5517719000 | 6134000000 |
| Thursday, January 1, 2015 | 5774247000 | 4889000000 |
| Friday, January 1, 2016 | 6513662000 | 4901000000 |
| Sunday, January 1, 2017 | 6539987000 | 5033000000 |
| Monday, January 1, 2018 | 6925178000 | 5670000000 |
| Tuesday, January 1, 2019 | 7818743000 | 4336000000 |
| Wednesday, January 1, 2020 | 7401679000 | 4601000000 |
| Friday, January 1, 2021 | 8401843000 | 5512000000 |
| Saturday, January 1, 2022 | 9472526000 | 5967000000 |
| Sunday, January 1, 2023 | 10493534000 | 5131000000 |
| Monday, January 1, 2024 | 4997000000 |
Unveiling the hidden dimensions of data
In the ever-evolving landscape of the construction and manufacturing sectors, understanding cost dynamics is crucial. From 2014 to 2023, EMCOR Group, Inc. and Masco Corporation have showcased distinct trajectories in their cost of revenue. EMCOR Group, Inc. has seen a robust growth of approximately 90% over this period, reflecting its strategic expansion and operational efficiency. In contrast, Masco Corporation's cost of revenue has remained relatively stable, with a slight decline of around 16% from its peak in 2014. This divergence highlights EMCOR's aggressive market positioning compared to Masco's steady approach. The data underscores the importance of cost management in maintaining competitive advantage and profitability. As the industry continues to face challenges, these insights provide a window into the strategic decisions shaping the future of these two giants.
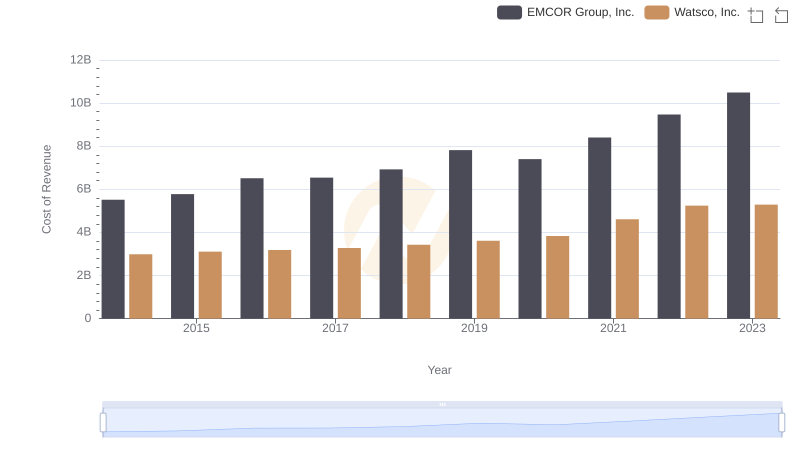
Cost Insights: Breaking Down EMCOR Group, Inc. and Watsco, Inc.'s Expenses
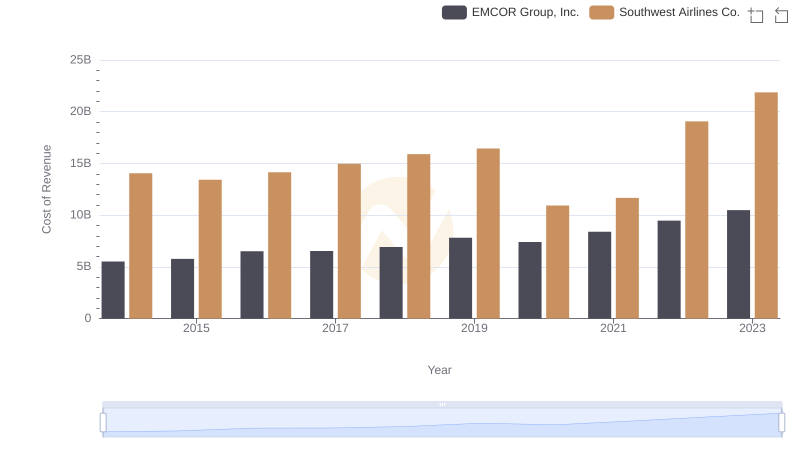
Analyzing Cost of Revenue: EMCOR Group, Inc. and Southwest Airlines Co.
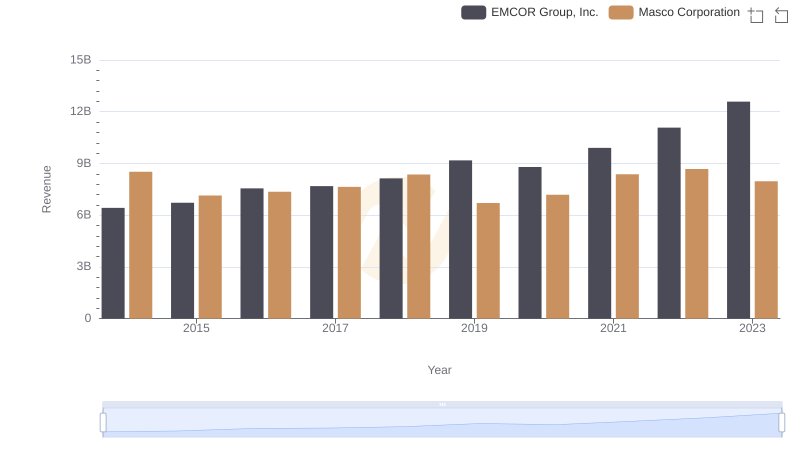
EMCOR Group, Inc. and Masco Corporation: A Comprehensive Revenue Analysis
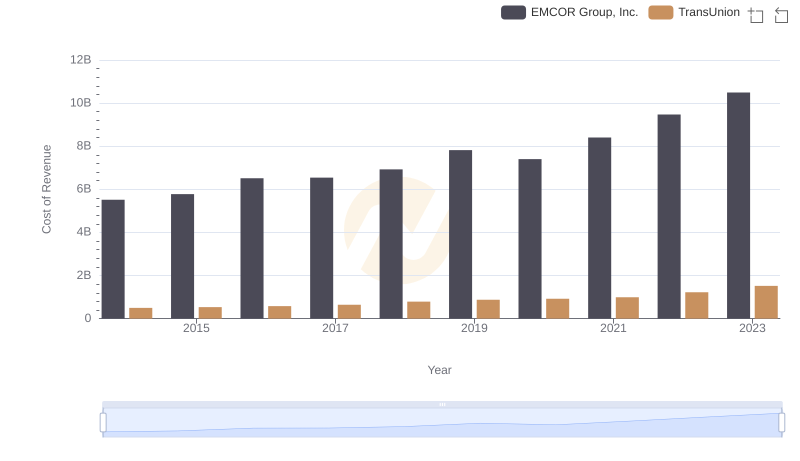
Cost of Revenue Trends: EMCOR Group, Inc. vs TransUnion
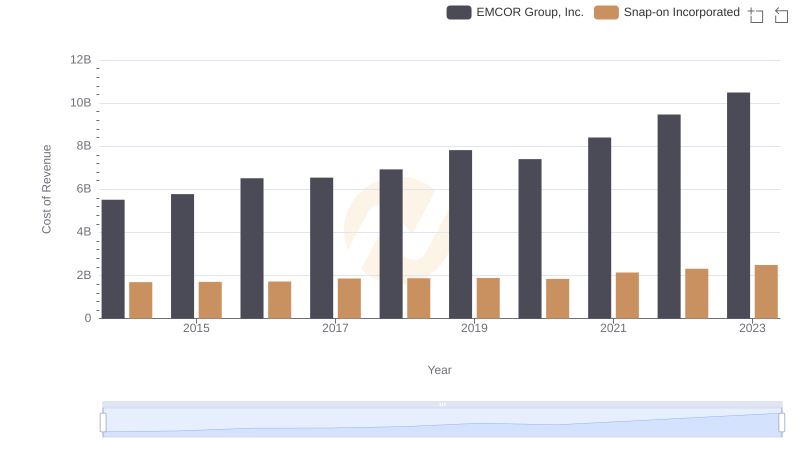
Cost of Revenue Comparison: EMCOR Group, Inc. vs Snap-on Incorporated
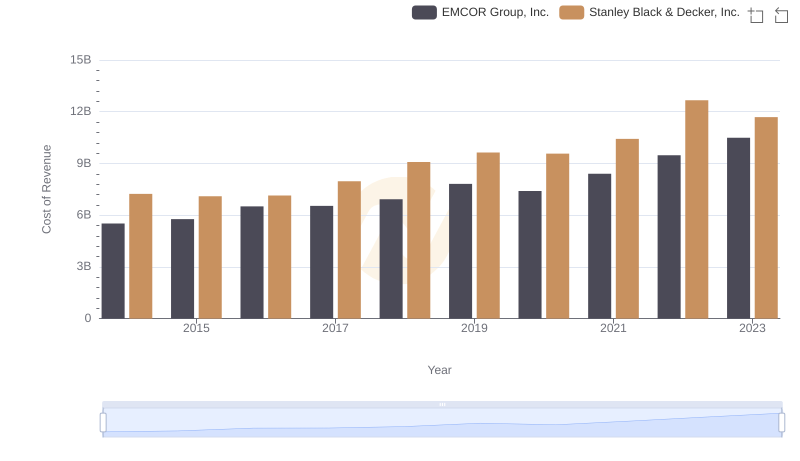
Cost of Revenue Trends: EMCOR Group, Inc. vs Stanley Black & Decker, Inc.
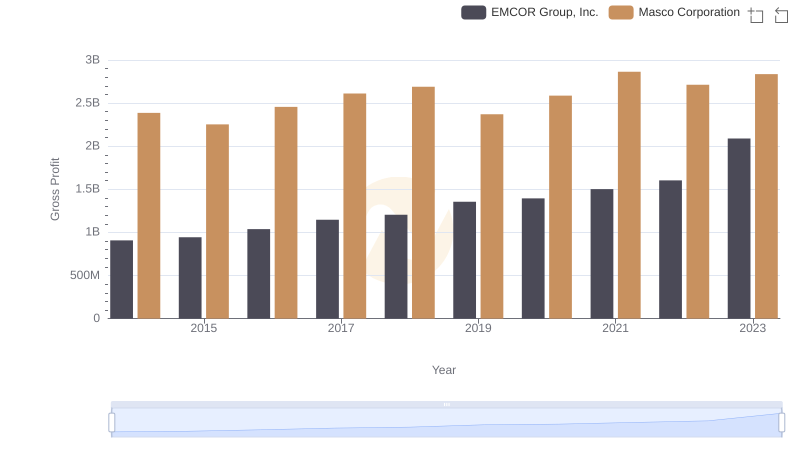
Gross Profit Trends Compared: EMCOR Group, Inc. vs Masco Corporation
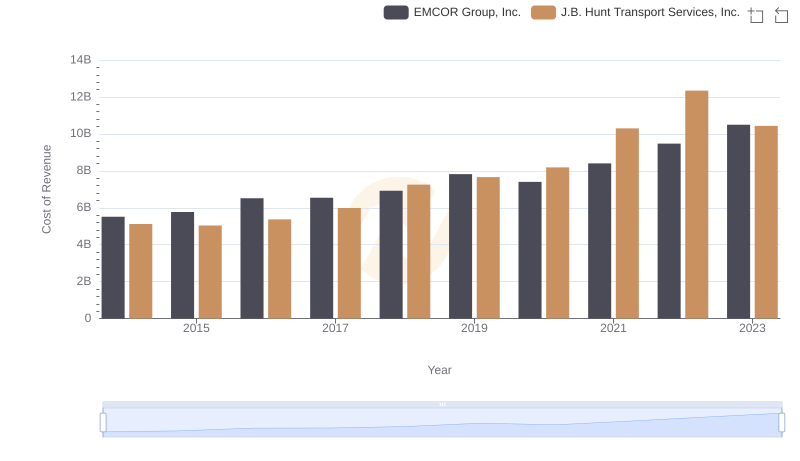
Cost of Revenue: Key Insights for EMCOR Group, Inc. and J.B. Hunt Transport Services, Inc.
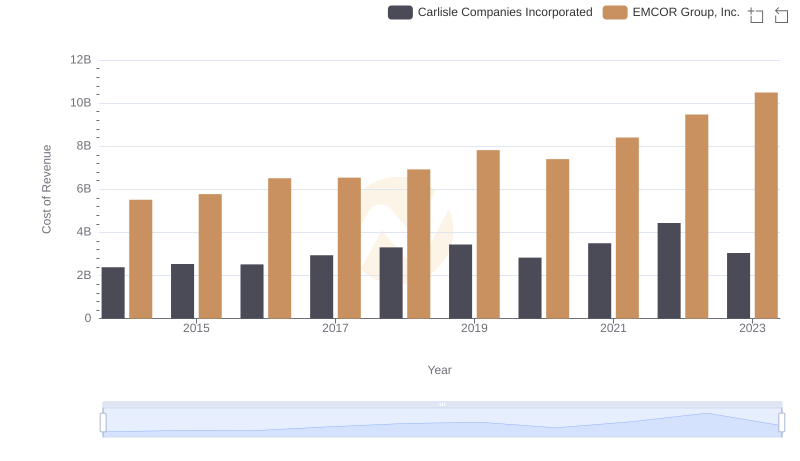
Comparing Cost of Revenue Efficiency: EMCOR Group, Inc. vs Carlisle Companies Incorporated
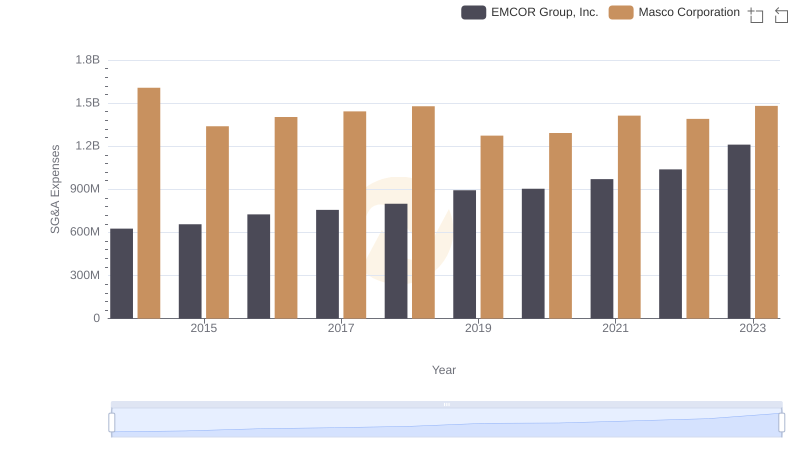
SG&A Efficiency Analysis: Comparing EMCOR Group, Inc. and Masco Corporation
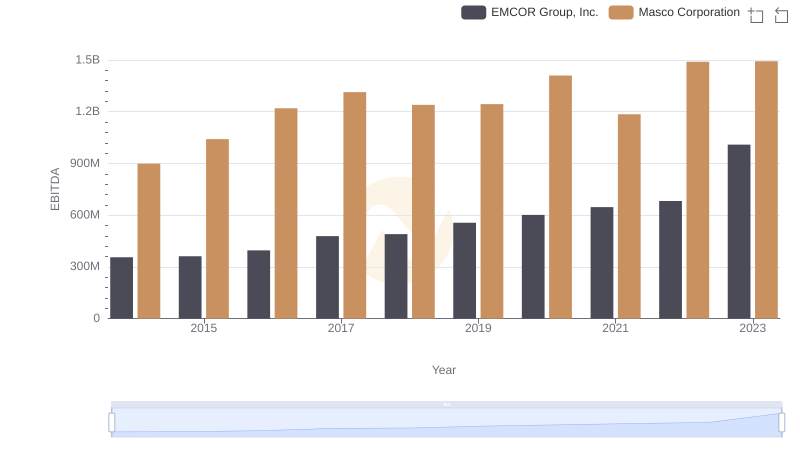
Professional EBITDA Benchmarking: EMCOR Group, Inc. vs Masco Corporation