| __timestamp | EMCOR Group, Inc. | Masco Corporation |
|---|---|---|
| Wednesday, January 1, 2014 | 355858000 | 899000000 |
| Thursday, January 1, 2015 | 362095000 | 1041000000 |
| Friday, January 1, 2016 | 395913000 | 1220000000 |
| Sunday, January 1, 2017 | 478459000 | 1314000000 |
| Monday, January 1, 2018 | 489954000 | 1240000000 |
| Tuesday, January 1, 2019 | 556055000 | 1244000000 |
| Wednesday, January 1, 2020 | 601449000 | 1410000000 |
| Friday, January 1, 2021 | 646861000 | 1185000000 |
| Saturday, January 1, 2022 | 682399000 | 1490000000 |
| Sunday, January 1, 2023 | 1009017000 | 1493000000 |
| Monday, January 1, 2024 | 1410000000 |
Data in motion
In the competitive landscape of the construction and home improvement sectors, EMCOR Group, Inc. and Masco Corporation have demonstrated remarkable EBITDA growth over the past decade. From 2014 to 2023, EMCOR's EBITDA surged by approximately 184%, reaching its peak in 2023. Meanwhile, Masco Corporation maintained a steady upward trajectory, with a 66% increase over the same period.
EMCOR Group, Inc.: Starting at 356 million in 2014, EMCOR's EBITDA grew consistently, culminating in a significant leap to over 1 billion by 2023. This growth reflects EMCOR's strategic expansions and operational efficiencies.
Masco Corporation: With a robust starting point of 899 million in 2014, Masco's EBITDA climbed to nearly 1.5 billion by 2023, underscoring its resilience and market adaptability.
These trends highlight the dynamic nature of the industry and the strategic prowess of these companies.
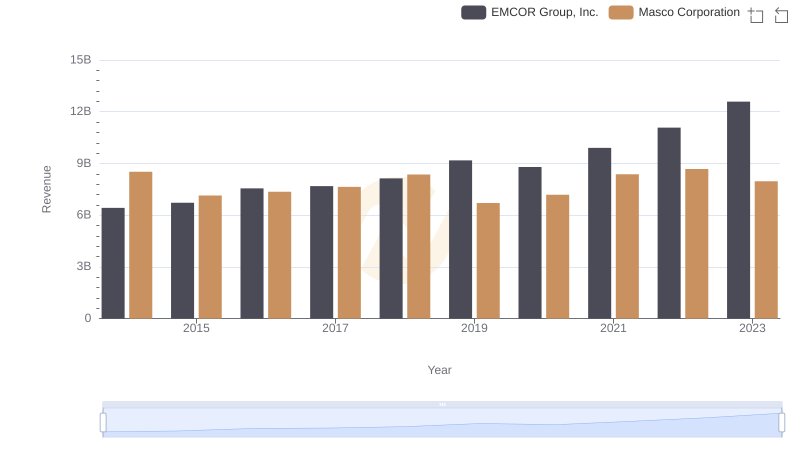
EMCOR Group, Inc. and Masco Corporation: A Comprehensive Revenue Analysis
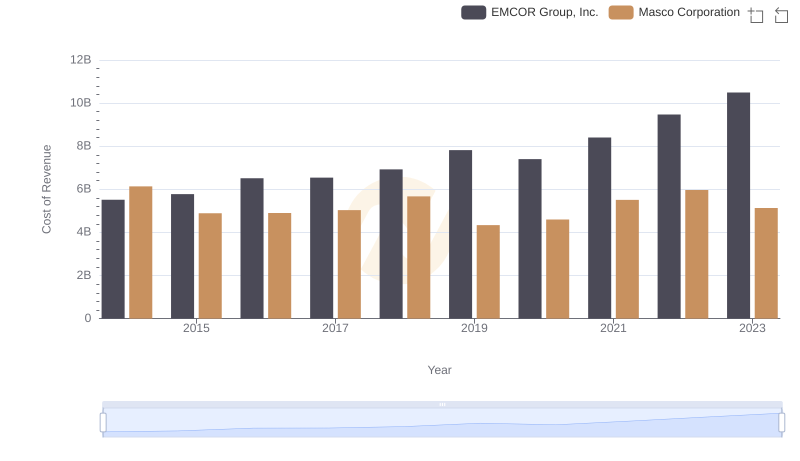
Cost of Revenue: Key Insights for EMCOR Group, Inc. and Masco Corporation
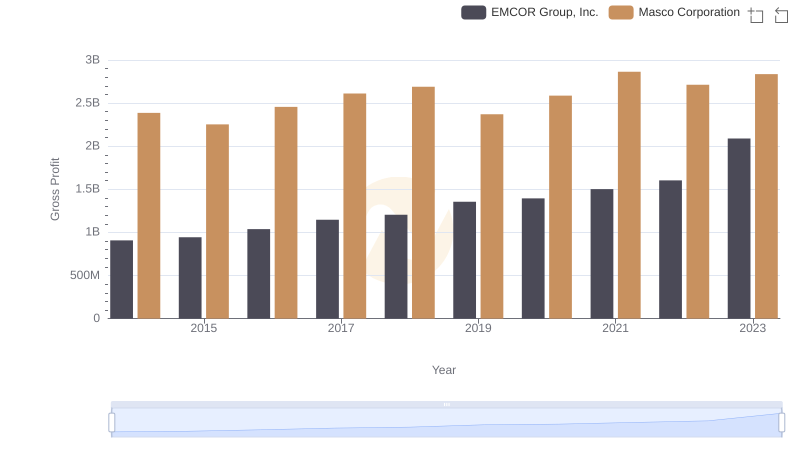
Gross Profit Trends Compared: EMCOR Group, Inc. vs Masco Corporation
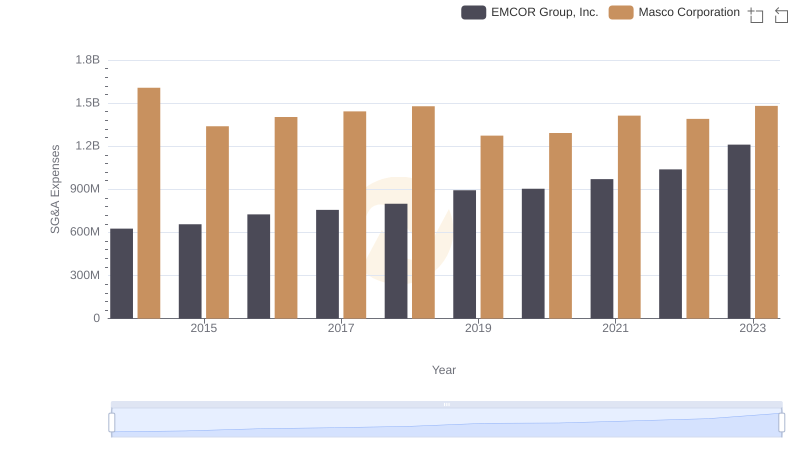
SG&A Efficiency Analysis: Comparing EMCOR Group, Inc. and Masco Corporation
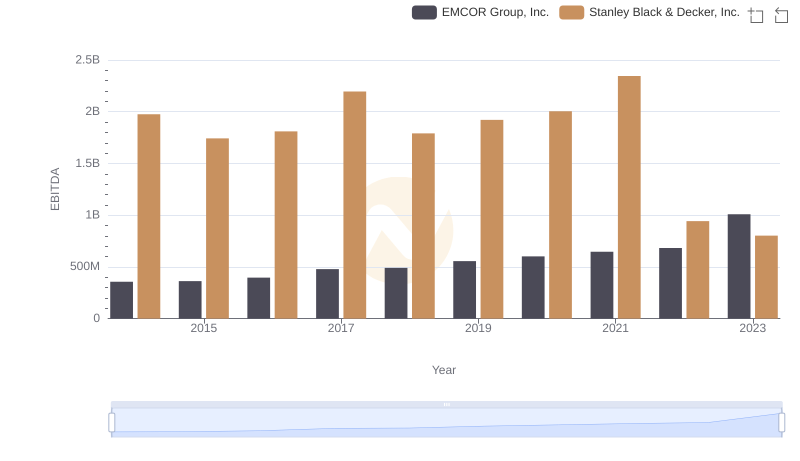
A Professional Review of EBITDA: EMCOR Group, Inc. Compared to Stanley Black & Decker, Inc.
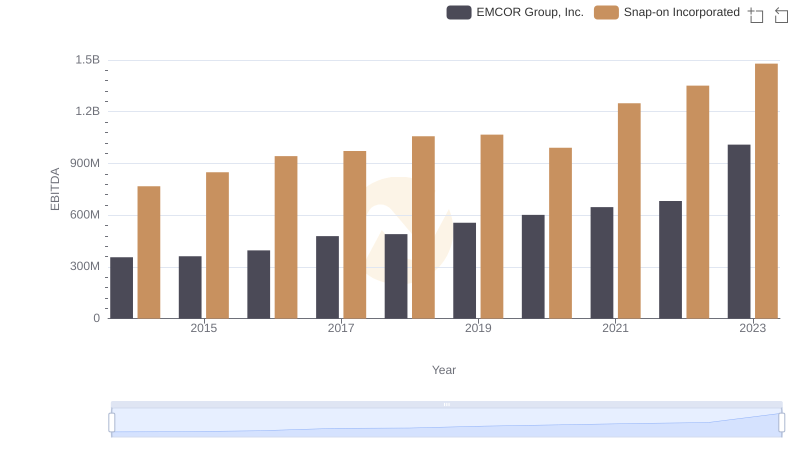
A Professional Review of EBITDA: EMCOR Group, Inc. Compared to Snap-on Incorporated
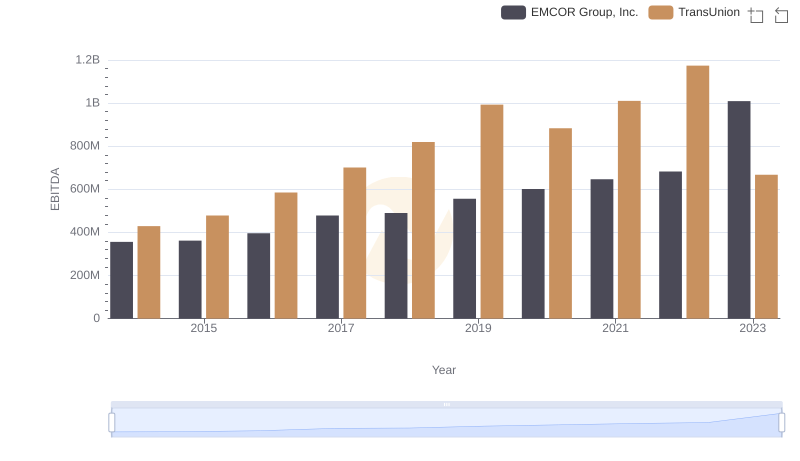
Comprehensive EBITDA Comparison: EMCOR Group, Inc. vs TransUnion
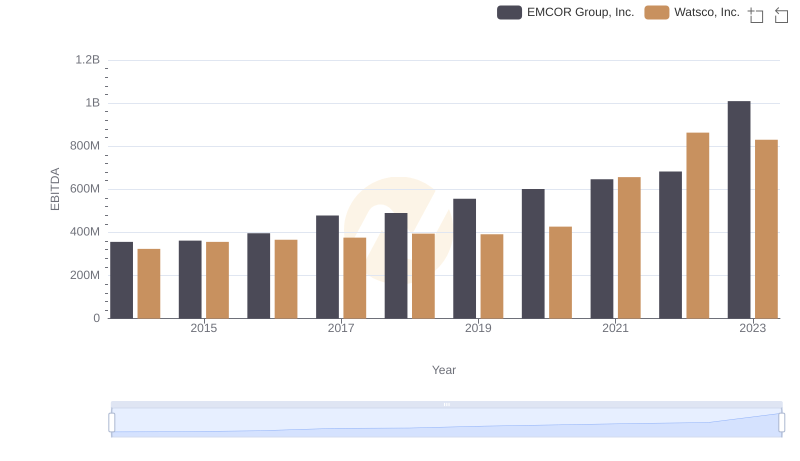
Comparative EBITDA Analysis: EMCOR Group, Inc. vs Watsco, Inc.
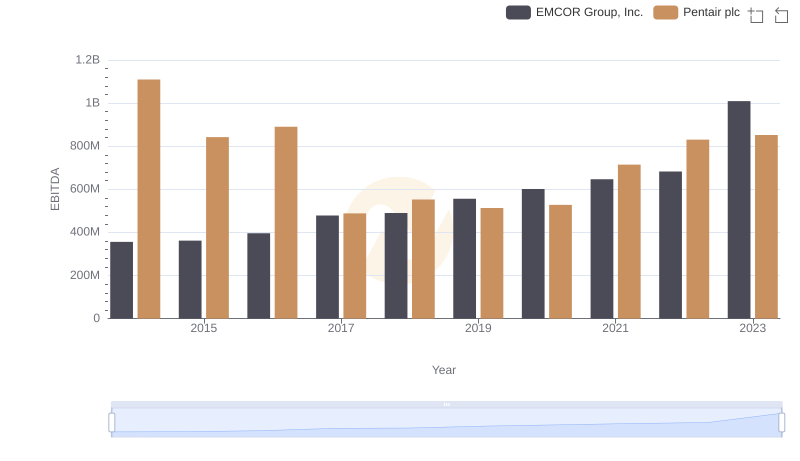
EBITDA Analysis: Evaluating EMCOR Group, Inc. Against Pentair plc
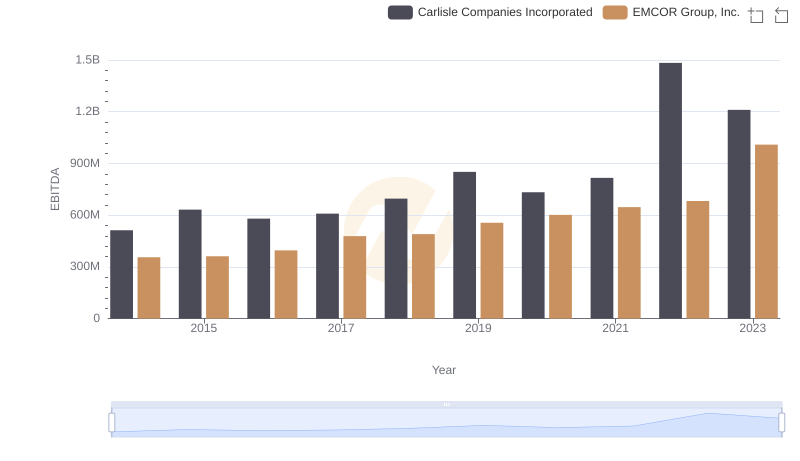
EMCOR Group, Inc. and Carlisle Companies Incorporated: A Detailed Examination of EBITDA Performance