| __timestamp | EMCOR Group, Inc. | Jacobs Engineering Group Inc. |
|---|---|---|
| Wednesday, January 1, 2014 | 6424965000 | 12695157000 |
| Thursday, January 1, 2015 | 6718726000 | 12114832000 |
| Friday, January 1, 2016 | 7551524000 | 10964157000 |
| Sunday, January 1, 2017 | 7686999000 | 10022788000 |
| Monday, January 1, 2018 | 8130631000 | 14984646000 |
| Tuesday, January 1, 2019 | 9174611000 | 12737868000 |
| Wednesday, January 1, 2020 | 8797061000 | 13566975000 |
| Friday, January 1, 2021 | 9903580000 | 14092632000 |
| Saturday, January 1, 2022 | 11076120000 | 14922825000 |
| Sunday, January 1, 2023 | 12582873000 | 16352414000 |
| Monday, January 1, 2024 | 11500941000 |
Unleashing the power of data
In the competitive landscape of engineering and construction, EMCOR Group, Inc. and Jacobs Engineering Group Inc. have showcased remarkable revenue trajectories over the past decade. From 2014 to 2023, EMCOR's revenue surged by approximately 96%, reflecting its robust growth strategy and market adaptability. Meanwhile, Jacobs Engineering, a leader in the industry, experienced a steady revenue increase of around 29% during the same period, underscoring its consistent performance and strategic acquisitions.
Despite missing data for 2024, these trends illustrate the dynamic nature of the engineering sector, with both companies poised for future growth.
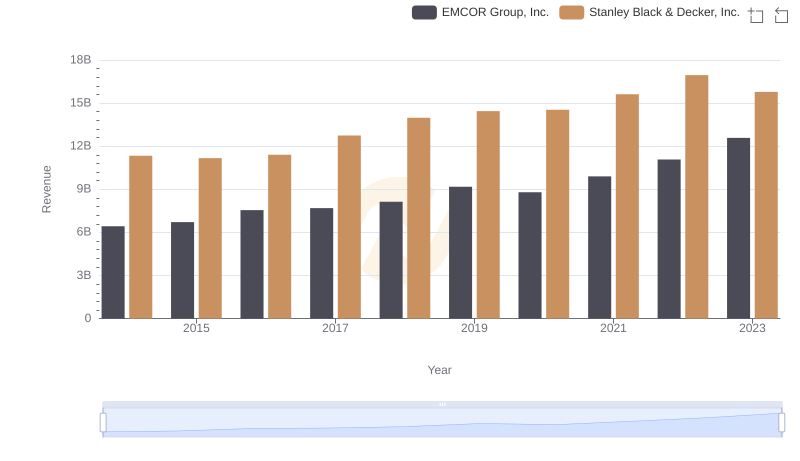
Annual Revenue Comparison: EMCOR Group, Inc. vs Stanley Black & Decker, Inc.
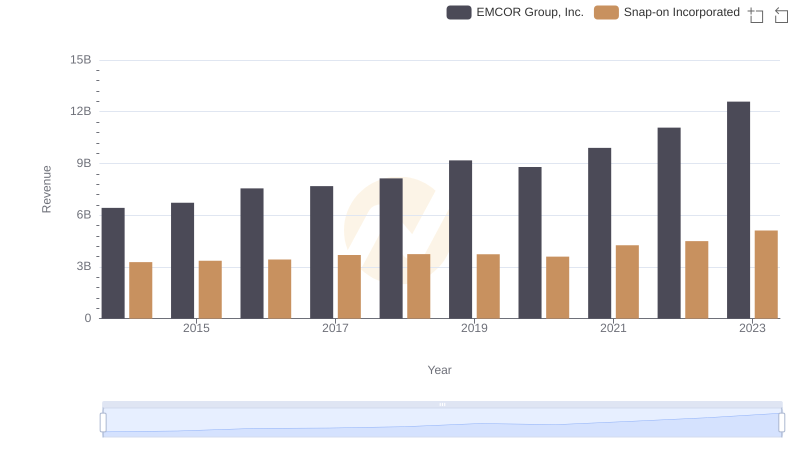
Annual Revenue Comparison: EMCOR Group, Inc. vs Snap-on Incorporated
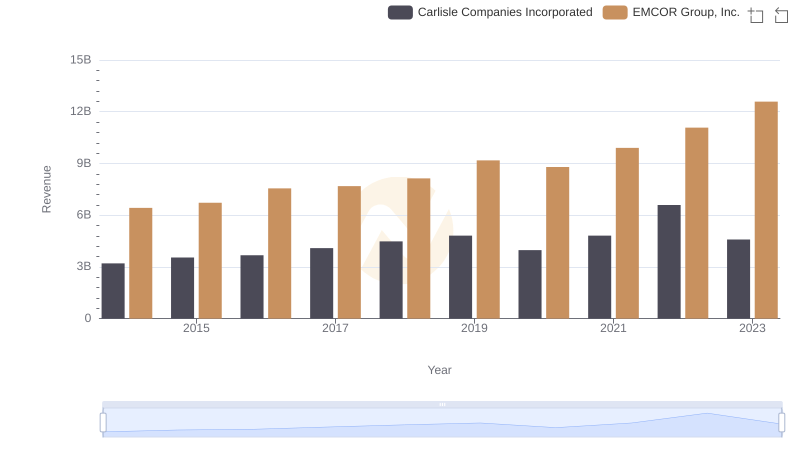
EMCOR Group, Inc. or Carlisle Companies Incorporated: Who Leads in Yearly Revenue?
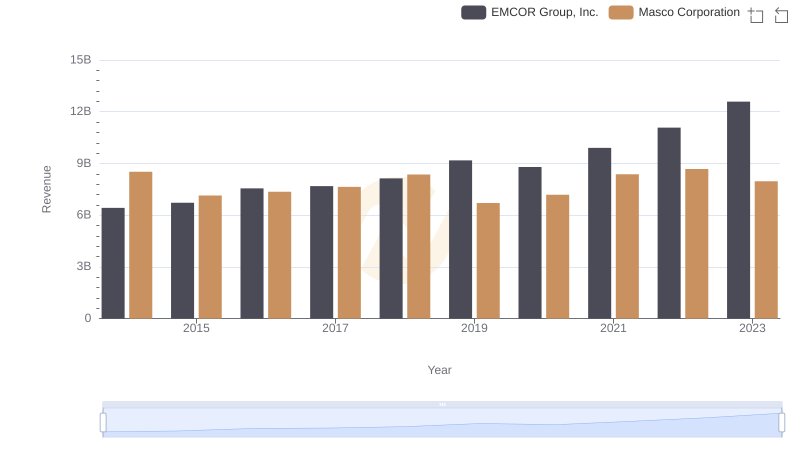
EMCOR Group, Inc. and Masco Corporation: A Comprehensive Revenue Analysis
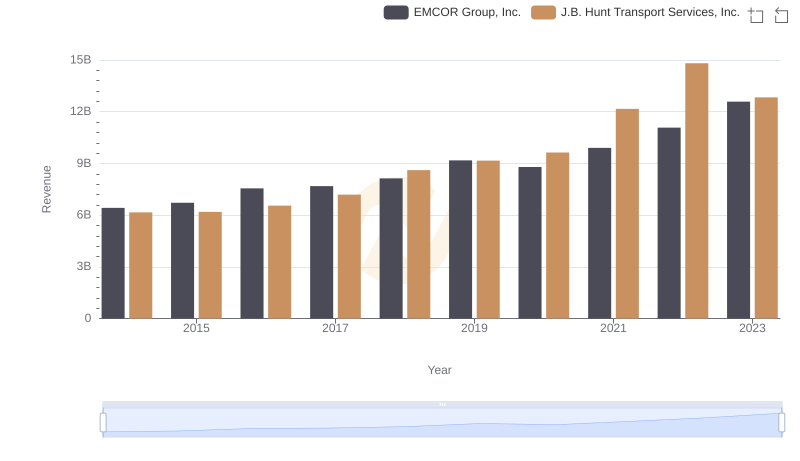
Annual Revenue Comparison: EMCOR Group, Inc. vs J.B. Hunt Transport Services, Inc.
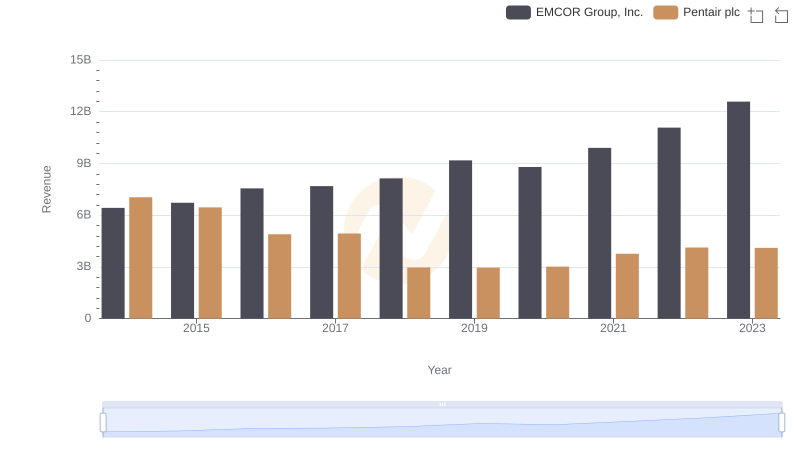
Revenue Insights: EMCOR Group, Inc. and Pentair plc Performance Compared
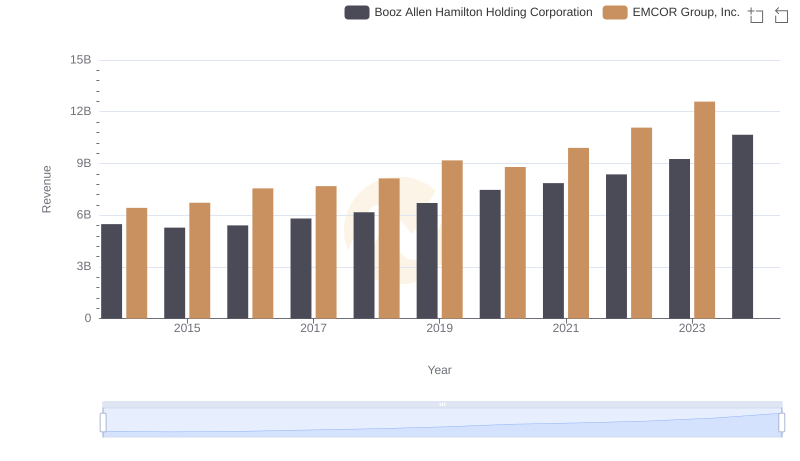
Revenue Insights: EMCOR Group, Inc. and Booz Allen Hamilton Holding Corporation Performance Compared
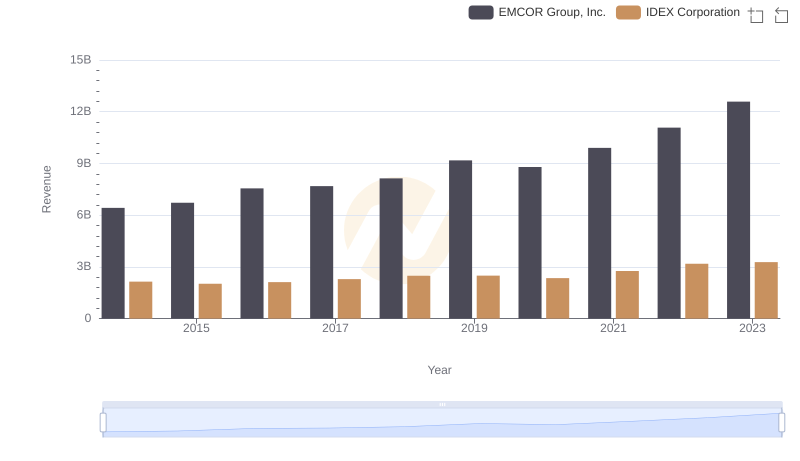
Comparing Revenue Performance: EMCOR Group, Inc. or IDEX Corporation?
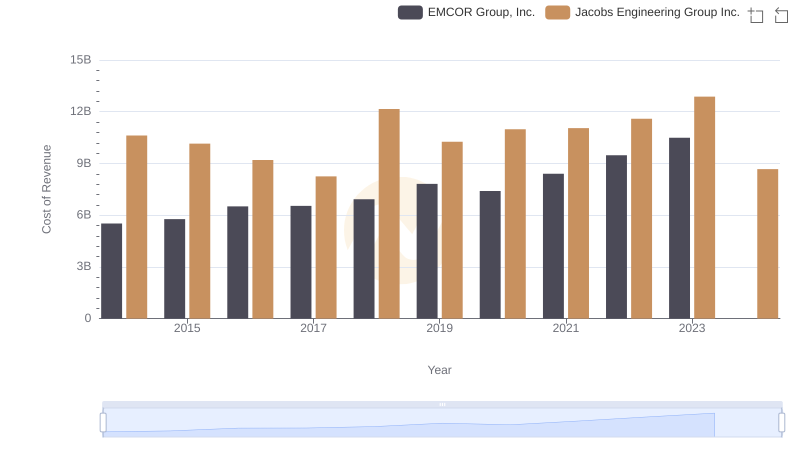
EMCOR Group, Inc. vs Jacobs Engineering Group Inc.: Efficiency in Cost of Revenue Explored
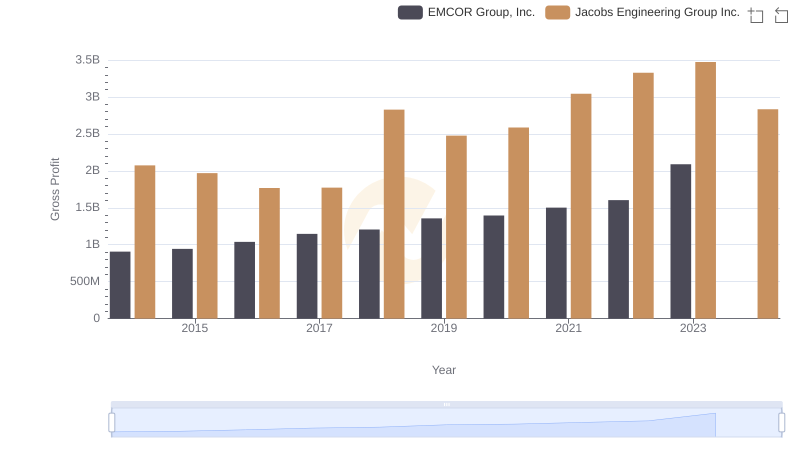
Who Generates Higher Gross Profit? EMCOR Group, Inc. or Jacobs Engineering Group Inc.
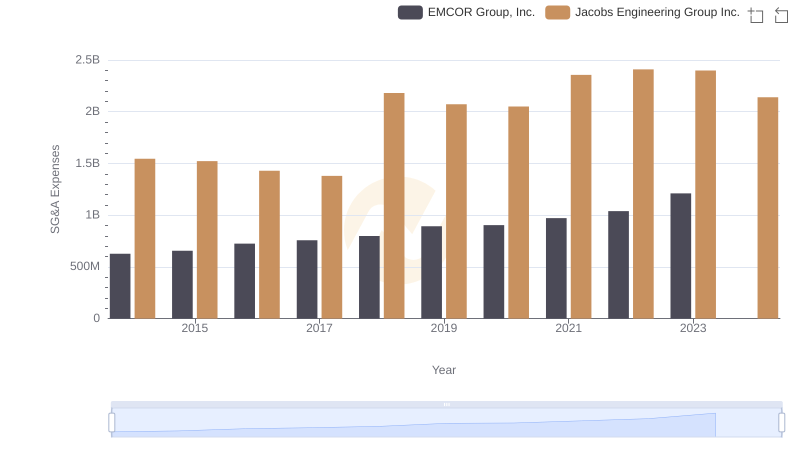
Selling, General, and Administrative Costs: EMCOR Group, Inc. vs Jacobs Engineering Group Inc.
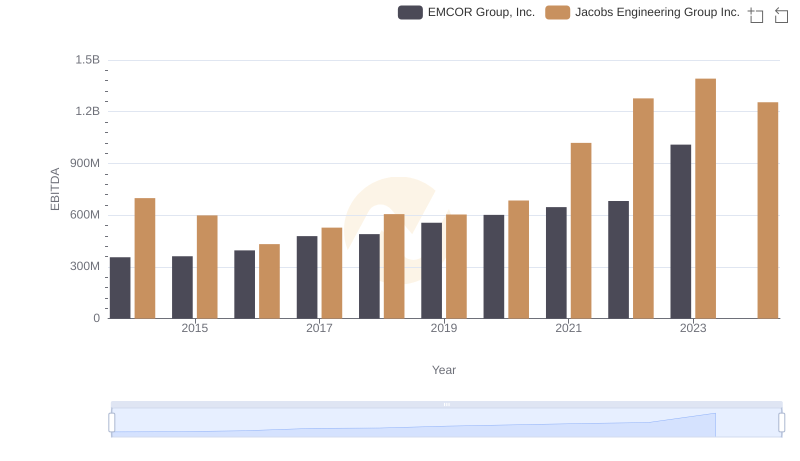
Comparative EBITDA Analysis: EMCOR Group, Inc. vs Jacobs Engineering Group Inc.