| __timestamp | EMCOR Group, Inc. | TransUnion |
|---|---|---|
| Wednesday, January 1, 2014 | 6424965000 | 1304700000 |
| Thursday, January 1, 2015 | 6718726000 | 1506800000 |
| Friday, January 1, 2016 | 7551524000 | 1704900000 |
| Sunday, January 1, 2017 | 7686999000 | 1933800000 |
| Monday, January 1, 2018 | 8130631000 | 2317200000 |
| Tuesday, January 1, 2019 | 9174611000 | 2656100000 |
| Wednesday, January 1, 2020 | 8797061000 | 2716600000 |
| Friday, January 1, 2021 | 9903580000 | 2960200000 |
| Saturday, January 1, 2022 | 11076120000 | 3709900000 |
| Sunday, January 1, 2023 | 12582873000 | 3831200000 |
| Monday, January 1, 2024 | 4183800000 |
Cracking the code
In the ever-evolving landscape of corporate finance, understanding revenue trends is crucial. Over the past decade, EMCOR Group, Inc. and TransUnion have showcased distinct growth trajectories. From 2014 to 2023, EMCOR Group, Inc. has seen its revenue soar by nearly 96%, reflecting its robust market strategies and adaptability. In contrast, TransUnion's revenue has grown by approximately 194%, highlighting its expanding influence in the data and analytics sector.
Starting in 2014, EMCOR's revenue was approximately 4.9 times that of TransUnion. By 2023, this ratio slightly decreased to around 3.3, indicating TransUnion's faster growth rate. This period marks a significant transformation for both companies, with EMCOR capitalizing on its diversified services and TransUnion leveraging the increasing demand for data-driven insights. As we look to the future, these trends offer a glimpse into the evolving dynamics of the industry.
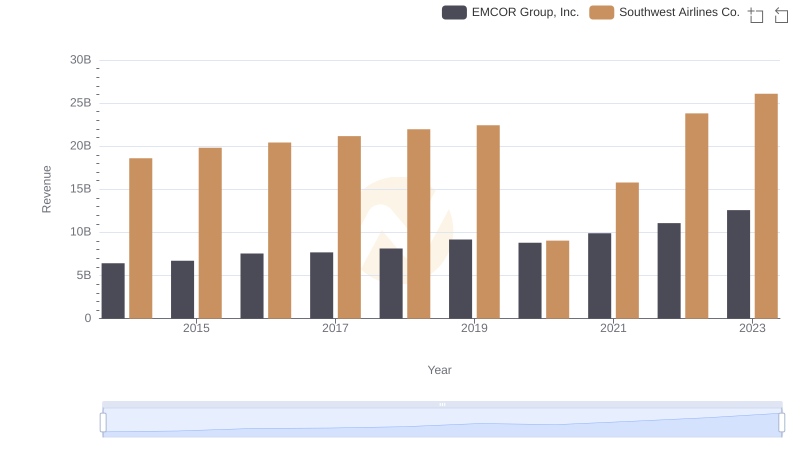
Revenue Insights: EMCOR Group, Inc. and Southwest Airlines Co. Performance Compared
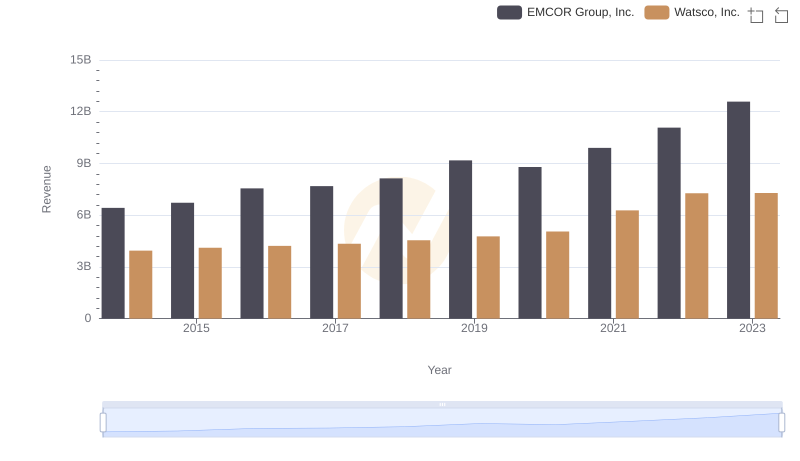
Revenue Showdown: EMCOR Group, Inc. vs Watsco, Inc.
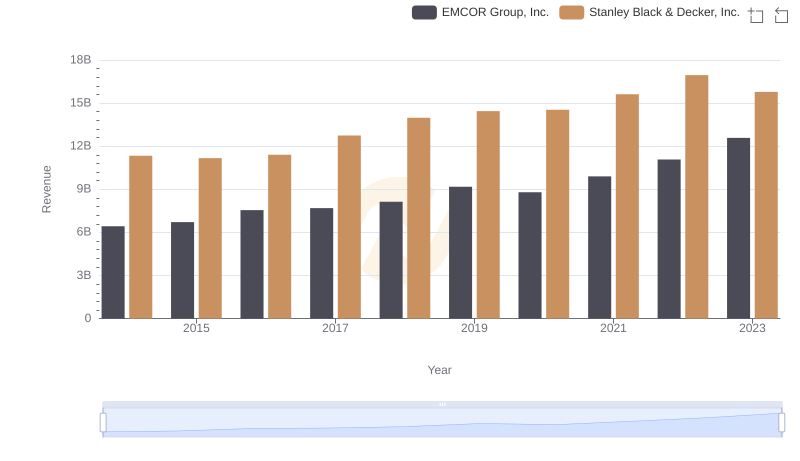
Annual Revenue Comparison: EMCOR Group, Inc. vs Stanley Black & Decker, Inc.
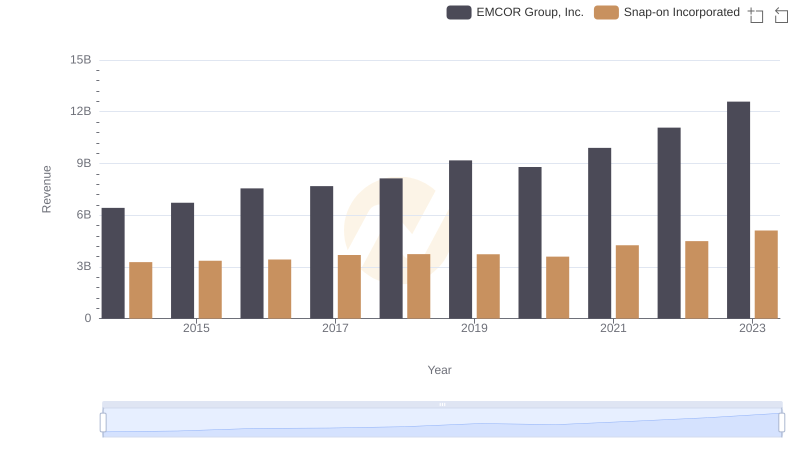
Annual Revenue Comparison: EMCOR Group, Inc. vs Snap-on Incorporated
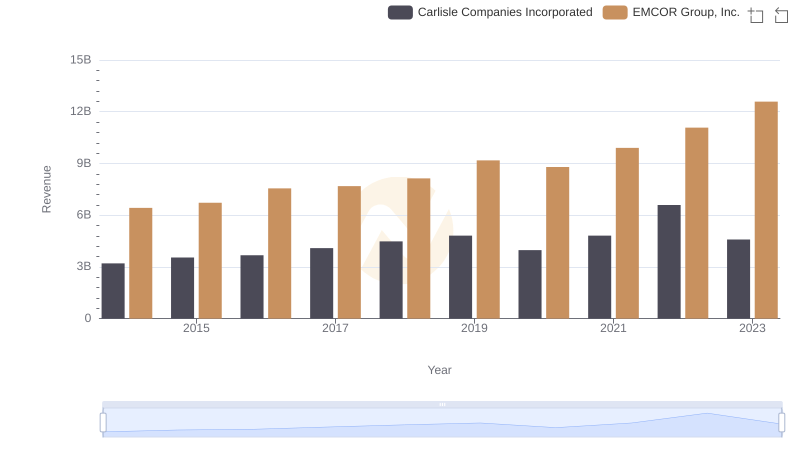
EMCOR Group, Inc. or Carlisle Companies Incorporated: Who Leads in Yearly Revenue?
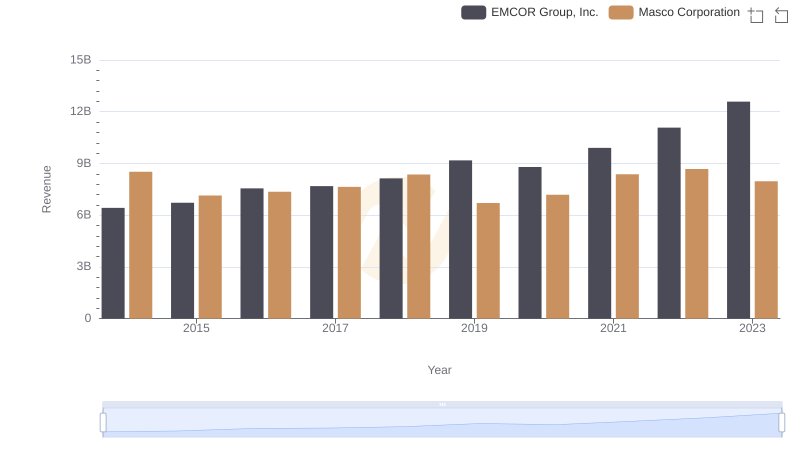
EMCOR Group, Inc. and Masco Corporation: A Comprehensive Revenue Analysis
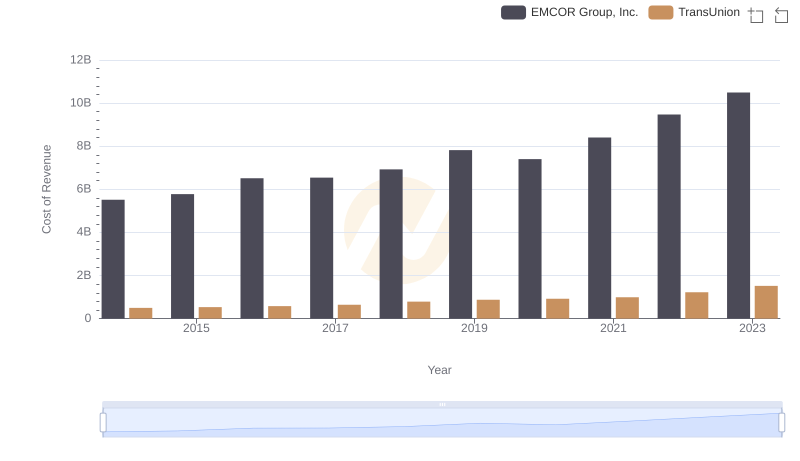
Cost of Revenue Trends: EMCOR Group, Inc. vs TransUnion
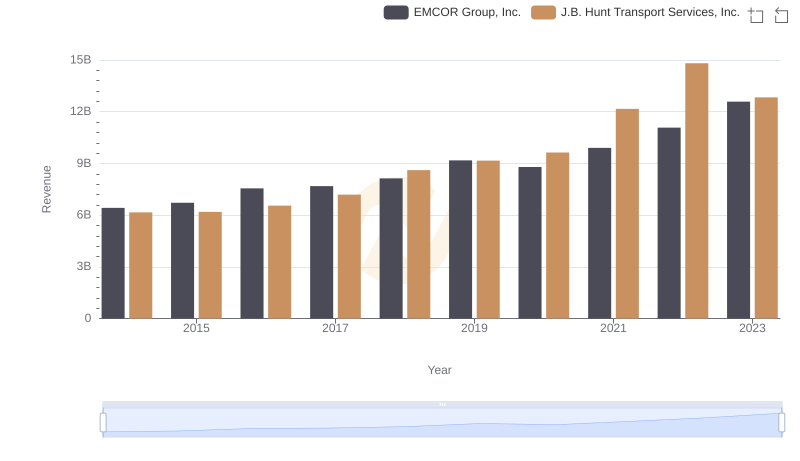
Annual Revenue Comparison: EMCOR Group, Inc. vs J.B. Hunt Transport Services, Inc.
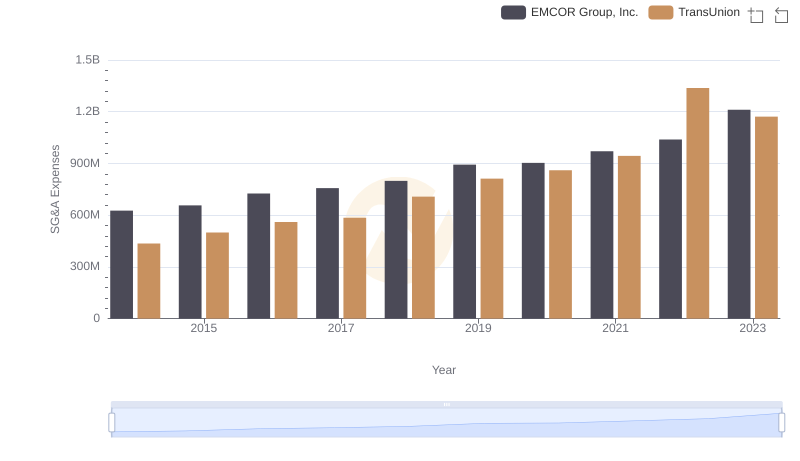
EMCOR Group, Inc. vs TransUnion: SG&A Expense Trends
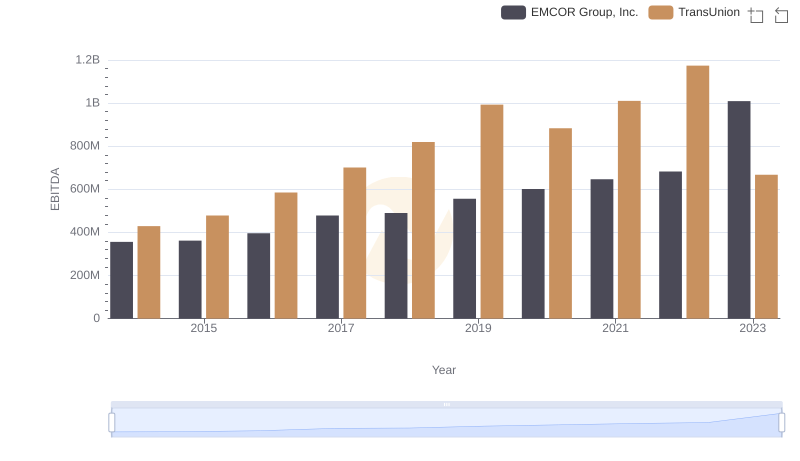
Comprehensive EBITDA Comparison: EMCOR Group, Inc. vs TransUnion