| __timestamp | EMCOR Group, Inc. | J.B. Hunt Transport Services, Inc. |
|---|---|---|
| Wednesday, January 1, 2014 | 6424965000 | 6165441000 |
| Thursday, January 1, 2015 | 6718726000 | 6187646000 |
| Friday, January 1, 2016 | 7551524000 | 6555459000 |
| Sunday, January 1, 2017 | 7686999000 | 7189568000 |
| Monday, January 1, 2018 | 8130631000 | 8614874000 |
| Tuesday, January 1, 2019 | 9174611000 | 9165258000 |
| Wednesday, January 1, 2020 | 8797061000 | 9636573000 |
| Friday, January 1, 2021 | 9903580000 | 12168302000 |
| Saturday, January 1, 2022 | 11076120000 | 14813999000 |
| Sunday, January 1, 2023 | 12582873000 | 12829665000 |
Unveiling the hidden dimensions of data
In the ever-evolving landscape of American industry, EMCOR Group, Inc. and J.B. Hunt Transport Services, Inc. have emerged as formidable players. Over the past decade, both companies have demonstrated impressive revenue growth, reflecting their resilience and adaptability in a competitive market. From 2014 to 2023, EMCOR's revenue surged by approximately 96%, while J.B. Hunt's revenue increased by about 108%. This growth trajectory highlights the dynamic nature of these industries, with EMCOR excelling in construction and facilities services, and J.B. Hunt leading in transportation and logistics.
By 2023, both companies reported revenues exceeding $12 billion, showcasing their significant market presence. Notably, J.B. Hunt's revenue peaked in 2022, surpassing EMCOR by 34%, before both companies converged in 2023. This convergence underscores the competitive balance and strategic maneuvers shaping their future.
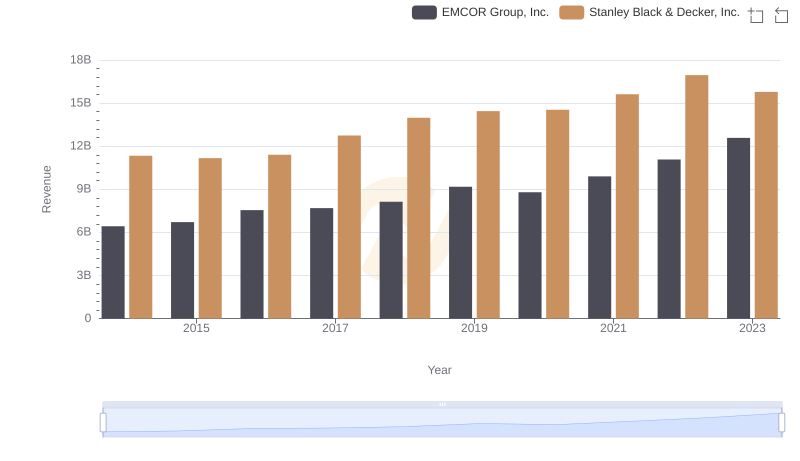
Annual Revenue Comparison: EMCOR Group, Inc. vs Stanley Black & Decker, Inc.
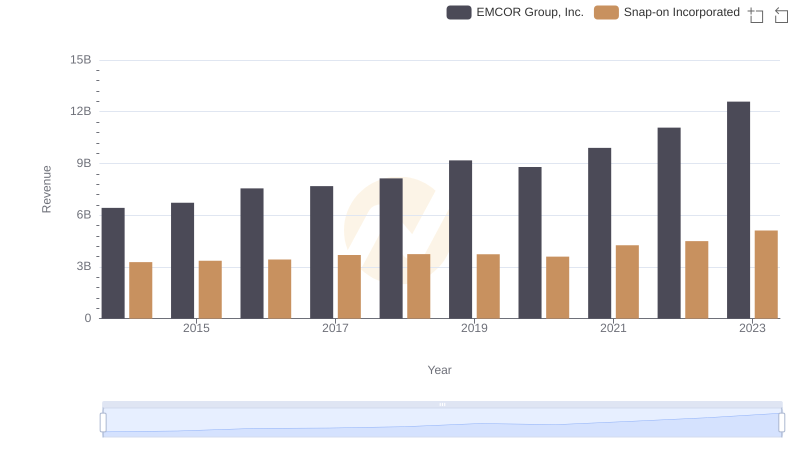
Annual Revenue Comparison: EMCOR Group, Inc. vs Snap-on Incorporated
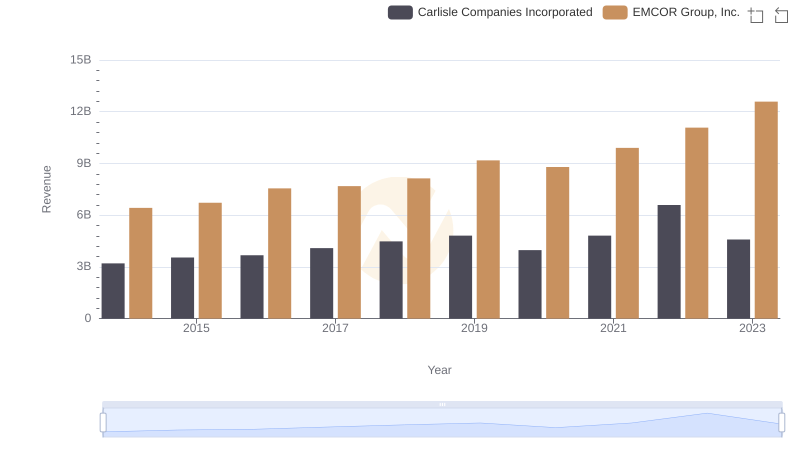
EMCOR Group, Inc. or Carlisle Companies Incorporated: Who Leads in Yearly Revenue?
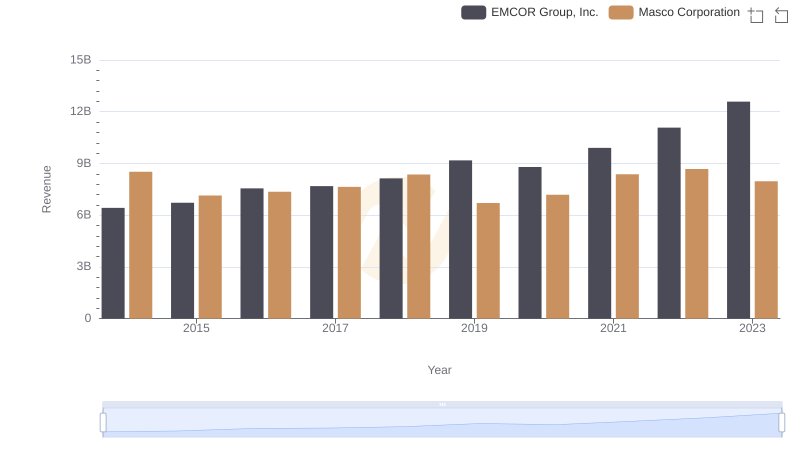
EMCOR Group, Inc. and Masco Corporation: A Comprehensive Revenue Analysis
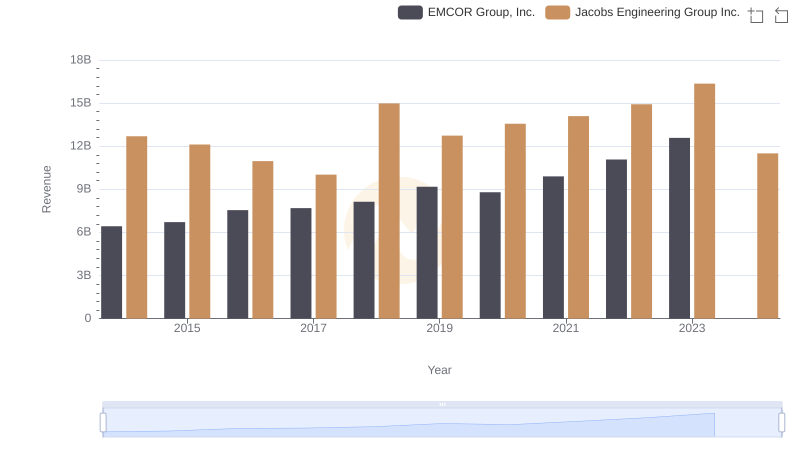
EMCOR Group, Inc. vs Jacobs Engineering Group Inc.: Examining Key Revenue Metrics
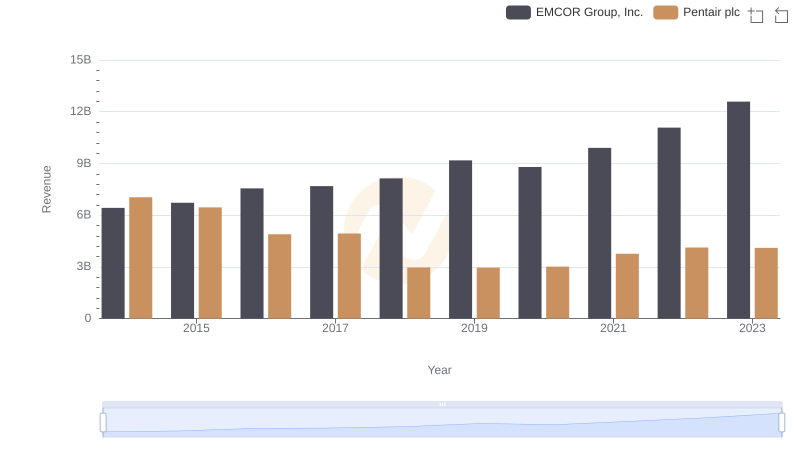
Revenue Insights: EMCOR Group, Inc. and Pentair plc Performance Compared
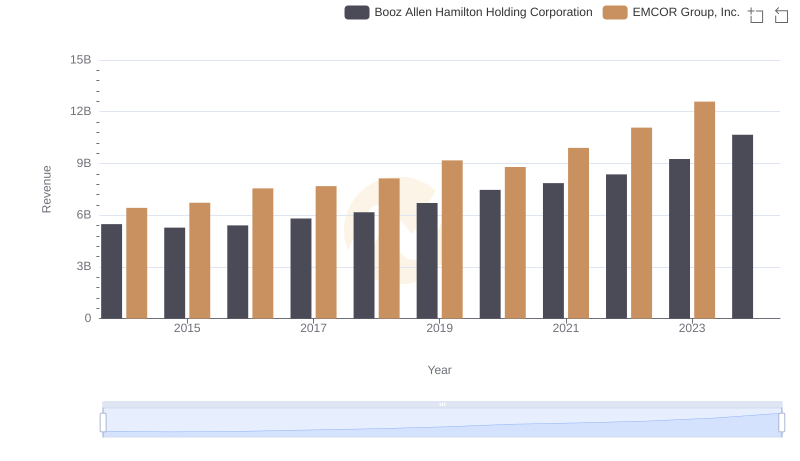
Revenue Insights: EMCOR Group, Inc. and Booz Allen Hamilton Holding Corporation Performance Compared
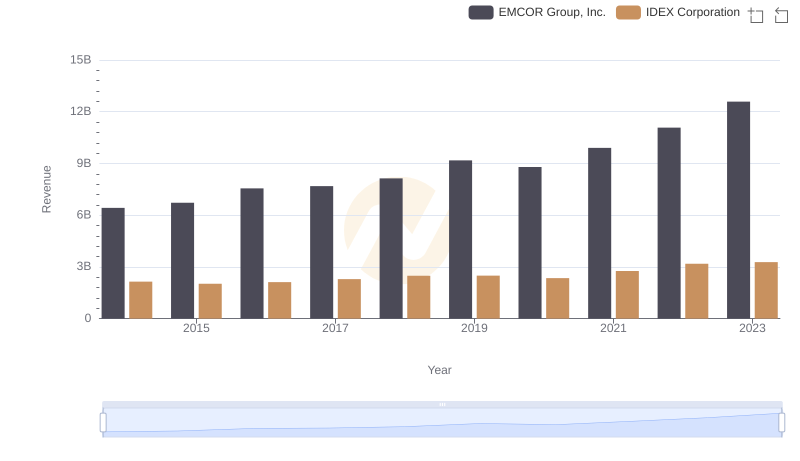
Comparing Revenue Performance: EMCOR Group, Inc. or IDEX Corporation?
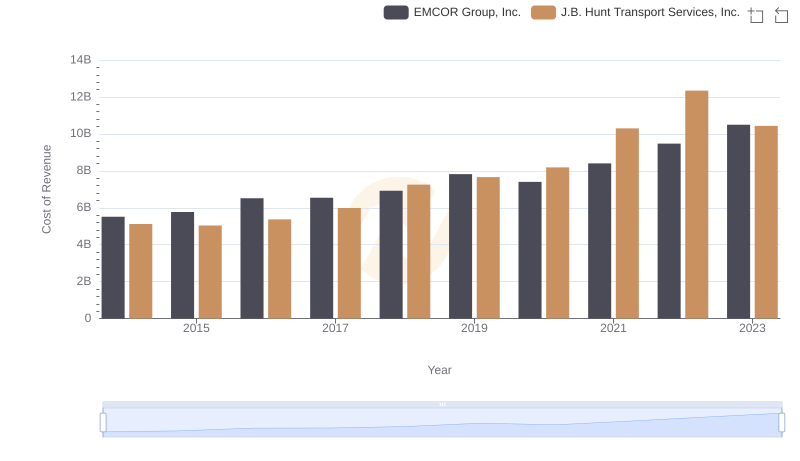
Cost of Revenue: Key Insights for EMCOR Group, Inc. and J.B. Hunt Transport Services, Inc.
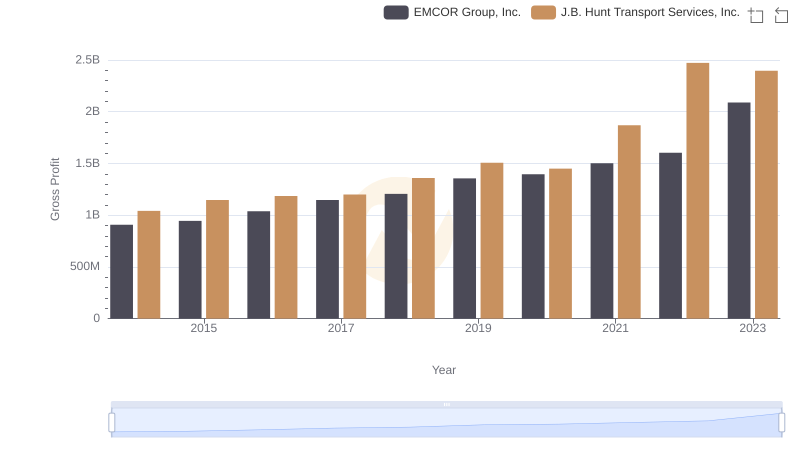
Gross Profit Trends Compared: EMCOR Group, Inc. vs J.B. Hunt Transport Services, Inc.

Breaking Down SG&A Expenses: EMCOR Group, Inc. vs J.B. Hunt Transport Services, Inc.
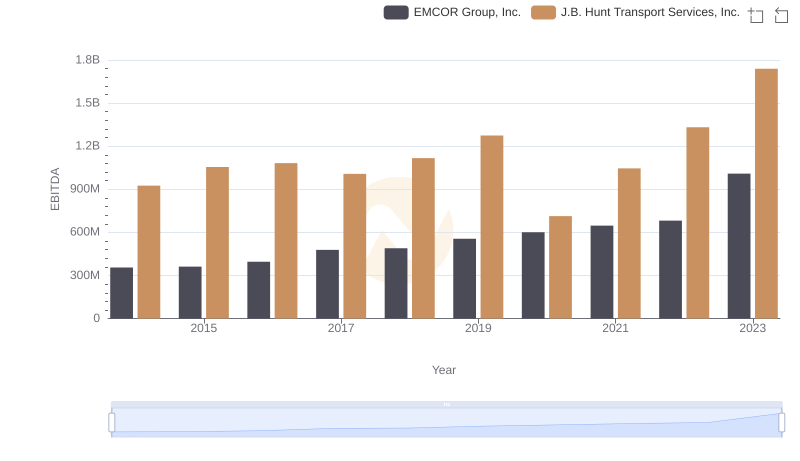
Comparative EBITDA Analysis: EMCOR Group, Inc. vs J.B. Hunt Transport Services, Inc.