| __timestamp | EMCOR Group, Inc. | Stanley Black & Decker, Inc. |
|---|---|---|
| Wednesday, January 1, 2014 | 6424965000 | 11338600000 |
| Thursday, January 1, 2015 | 6718726000 | 11171800000 |
| Friday, January 1, 2016 | 7551524000 | 11406900000 |
| Sunday, January 1, 2017 | 7686999000 | 12747200000 |
| Monday, January 1, 2018 | 8130631000 | 13982400000 |
| Tuesday, January 1, 2019 | 9174611000 | 14442200000 |
| Wednesday, January 1, 2020 | 8797061000 | 14534600000 |
| Friday, January 1, 2021 | 9903580000 | 15617200000 |
| Saturday, January 1, 2022 | 11076120000 | 16947400000 |
| Sunday, January 1, 2023 | 12582873000 | 15781100000 |
| Monday, January 1, 2024 | 15365700000 |
Unlocking the unknown
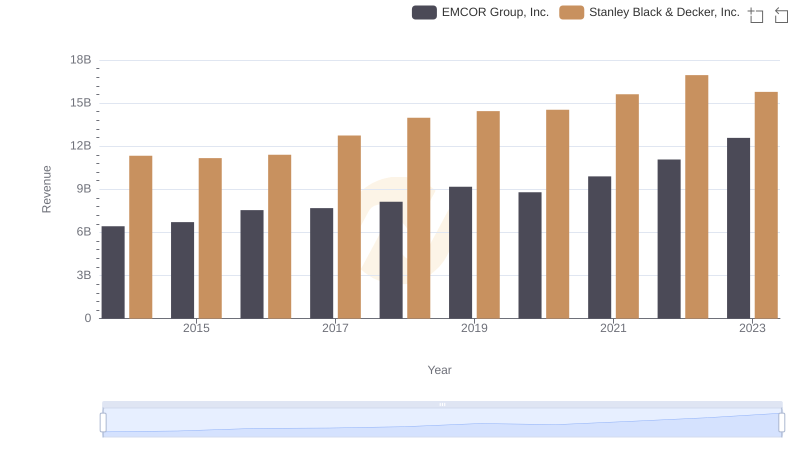
In the competitive landscape of industrial services and tools, EMCOR Group, Inc. and Stanley Black & Decker, Inc. have been formidable players. Over the past decade, from 2014 to 2023, these companies have shown remarkable growth in their annual revenues. EMCOR Group, Inc. has seen its revenue grow by approximately 96%, starting from $6.4 billion in 2014 to an impressive $12.6 billion in 2023. Meanwhile, Stanley Black & Decker, Inc. has maintained its lead, with a 39% increase, reaching $15.8 billion in 2023 from $11.3 billion in 2014.
This revenue trajectory highlights the resilience and strategic prowess of both companies in navigating market challenges. While EMCOR's growth rate is commendable, Stanley Black & Decker's consistent revenue dominance underscores its strong market position. As these giants continue to innovate, their financial journeys offer valuable insights into the industrial sector's evolving dynamics.
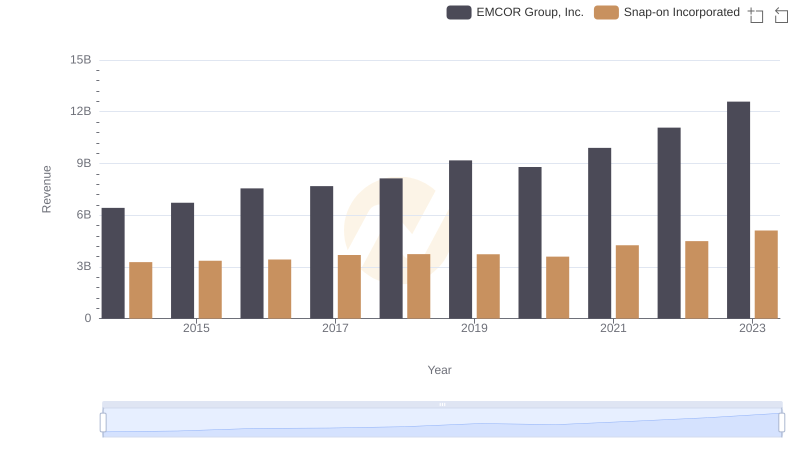
Annual Revenue Comparison: EMCOR Group, Inc. vs Snap-on Incorporated
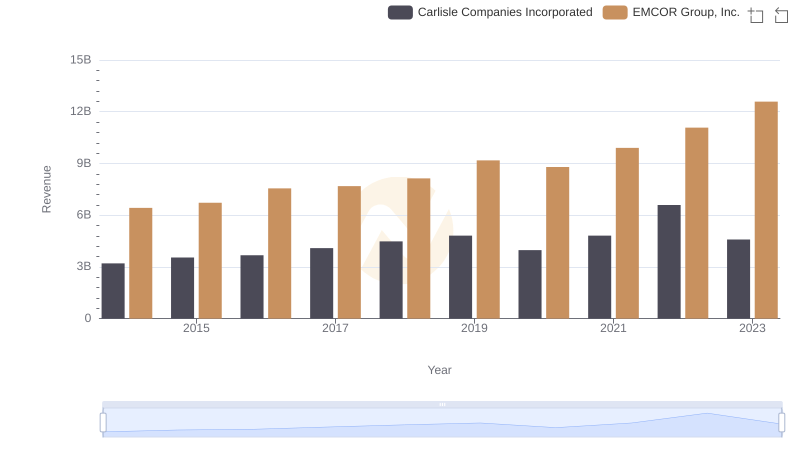
EMCOR Group, Inc. or Carlisle Companies Incorporated: Who Leads in Yearly Revenue?
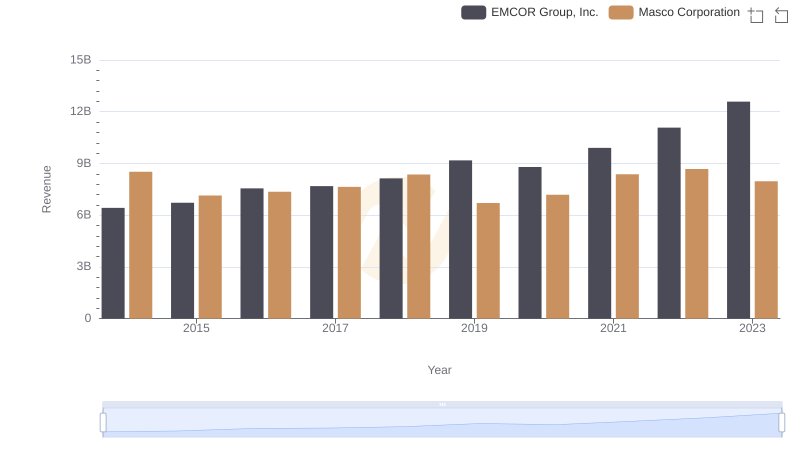
EMCOR Group, Inc. and Masco Corporation: A Comprehensive Revenue Analysis
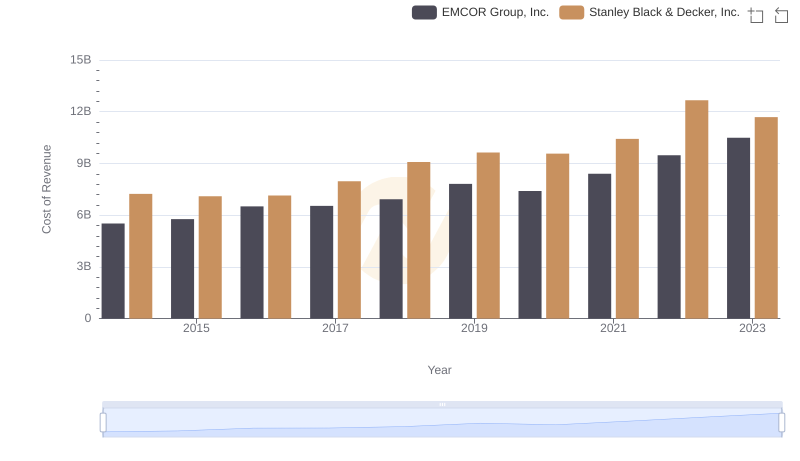
Cost of Revenue Trends: EMCOR Group, Inc. vs Stanley Black & Decker, Inc.
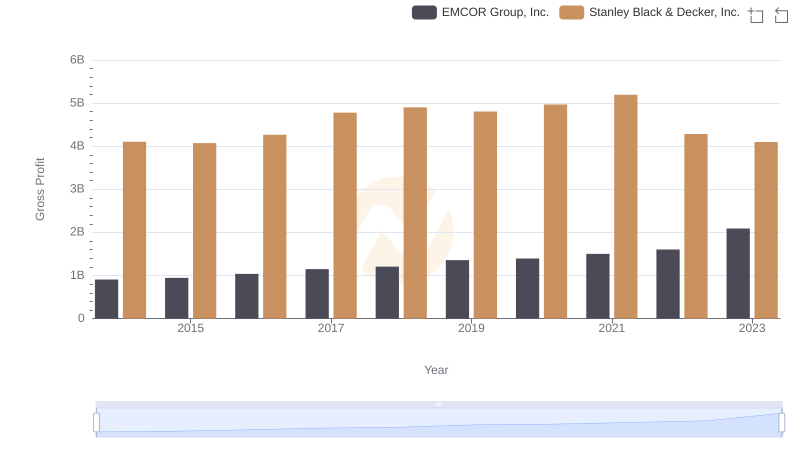
Key Insights on Gross Profit: EMCOR Group, Inc. vs Stanley Black & Decker, Inc.

A Professional Review of EBITDA: EMCOR Group, Inc. Compared to Stanley Black & Decker, Inc.
EMCOR Group, Inc. or Stanley Black & Decker, Inc.: Who Leads in Yearly Revenue?

Cost of Revenue: Key Insights for EMCOR Group, Inc. and Stanley Black & Decker, Inc.

Gross Profit Comparison: EMCOR Group, Inc. and Stanley Black & Decker, Inc. Trends
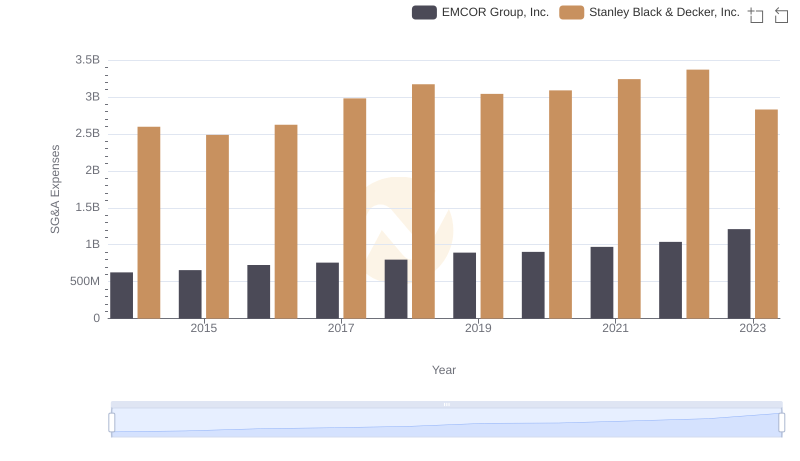
Selling, General, and Administrative Costs: EMCOR Group, Inc. vs Stanley Black & Decker, Inc.
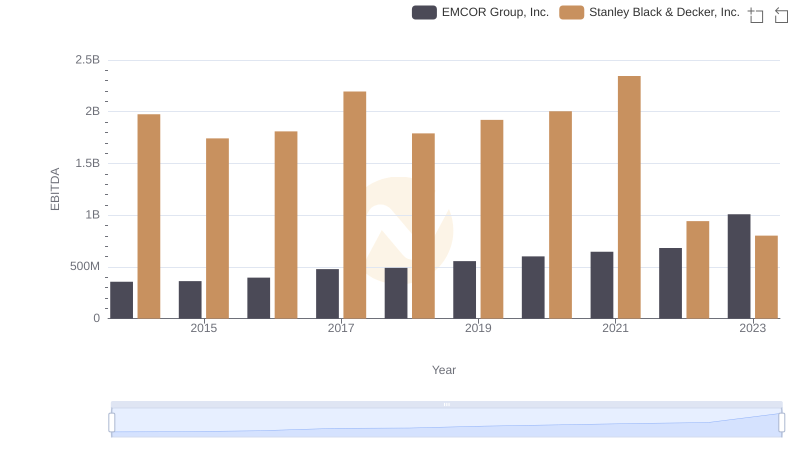
EMCOR Group, Inc. and Stanley Black & Decker, Inc.: A Detailed Examination of EBITDA Performance