| __timestamp | Allegion plc | EMCOR Group, Inc. |
|---|---|---|
| Wednesday, January 1, 2014 | 365700000 | 355858000 |
| Thursday, January 1, 2015 | 315400000 | 362095000 |
| Friday, January 1, 2016 | 422600000 | 395913000 |
| Sunday, January 1, 2017 | 523300000 | 478459000 |
| Monday, January 1, 2018 | 617600000 | 489954000 |
| Tuesday, January 1, 2019 | 614300000 | 556055000 |
| Wednesday, January 1, 2020 | 497700000 | 601449000 |
| Friday, January 1, 2021 | 657300000 | 646861000 |
| Saturday, January 1, 2022 | 688300000 | 682399000 |
| Sunday, January 1, 2023 | 819300000 | 1009017000 |
| Monday, January 1, 2024 | 919800000 |
Unleashing the power of data
In the ever-evolving landscape of the construction and security industries, EMCOR Group, Inc. and Allegion plc have emerged as formidable players. Over the past decade, these companies have demonstrated remarkable EBITDA growth, reflecting their strategic prowess and market adaptability. From 2014 to 2023, EMCOR Group, Inc. saw its EBITDA surge by approximately 183%, culminating in 2023 with a peak performance. Allegion plc, not to be outdone, achieved an impressive 124% increase in the same period.
This analysis underscores the dynamic nature of these industries and the strategic maneuvers that drive financial success.
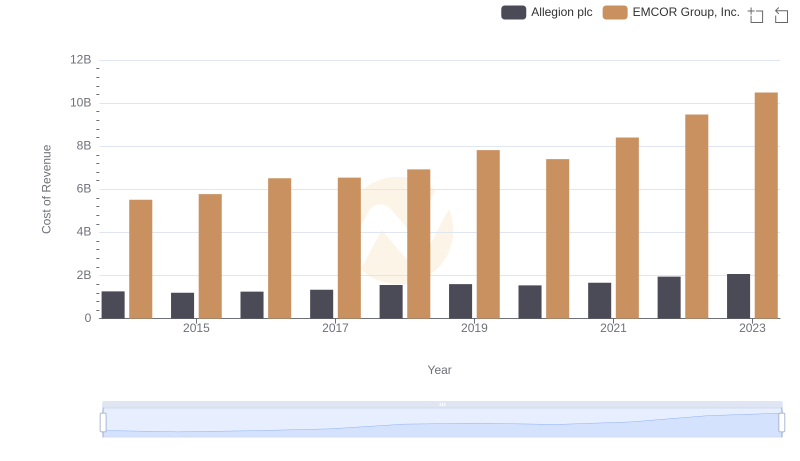
Cost Insights: Breaking Down EMCOR Group, Inc. and Allegion plc's Expenses
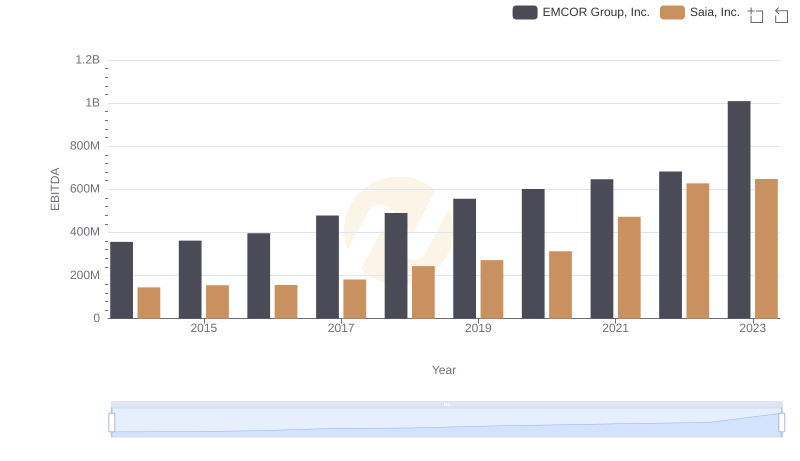
A Side-by-Side Analysis of EBITDA: EMCOR Group, Inc. and Saia, Inc.
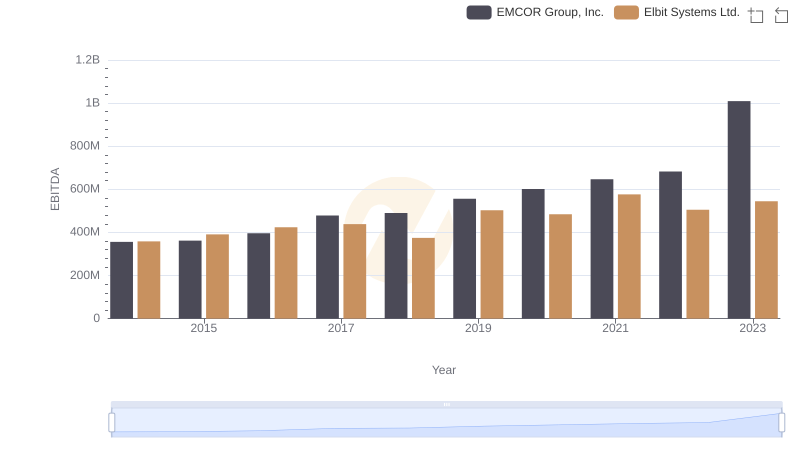
Professional EBITDA Benchmarking: EMCOR Group, Inc. vs Elbit Systems Ltd.
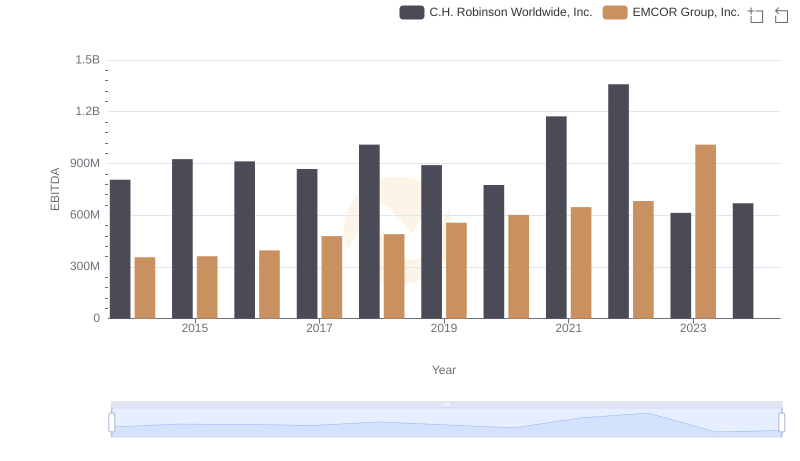
Comparative EBITDA Analysis: EMCOR Group, Inc. vs C.H. Robinson Worldwide, Inc.
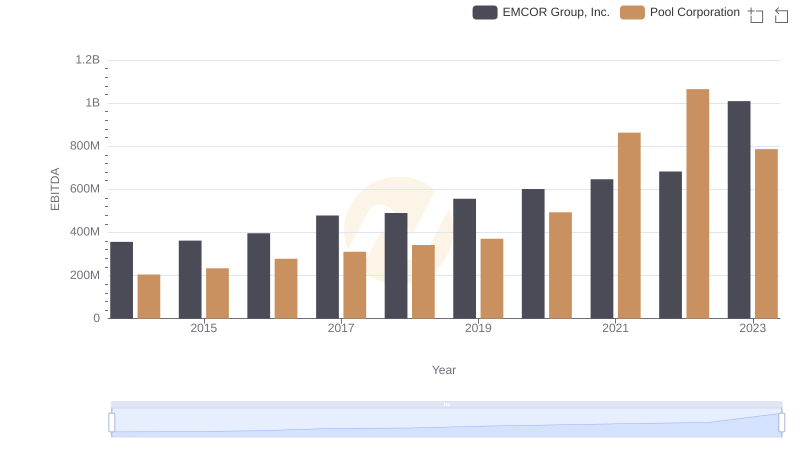
Professional EBITDA Benchmarking: EMCOR Group, Inc. vs Pool Corporation
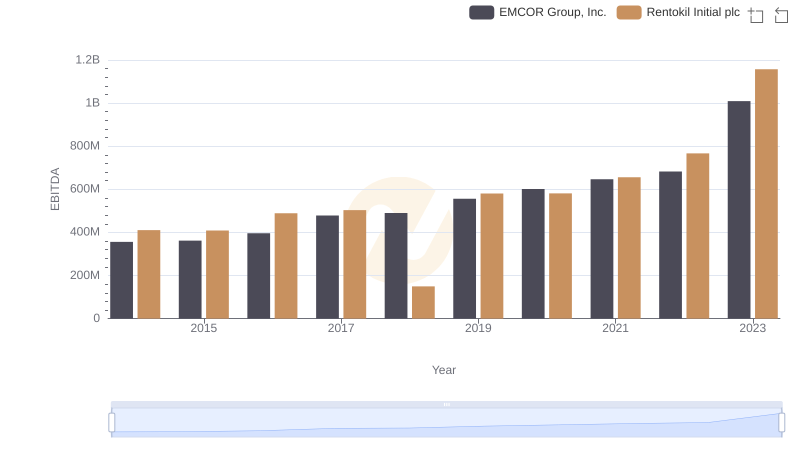
EBITDA Performance Review: EMCOR Group, Inc. vs Rentokil Initial plc
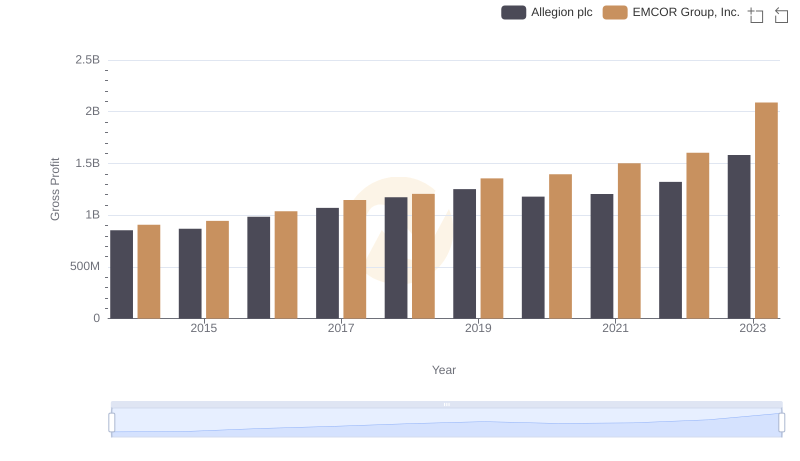
Gross Profit Trends Compared: EMCOR Group, Inc. vs Allegion plc
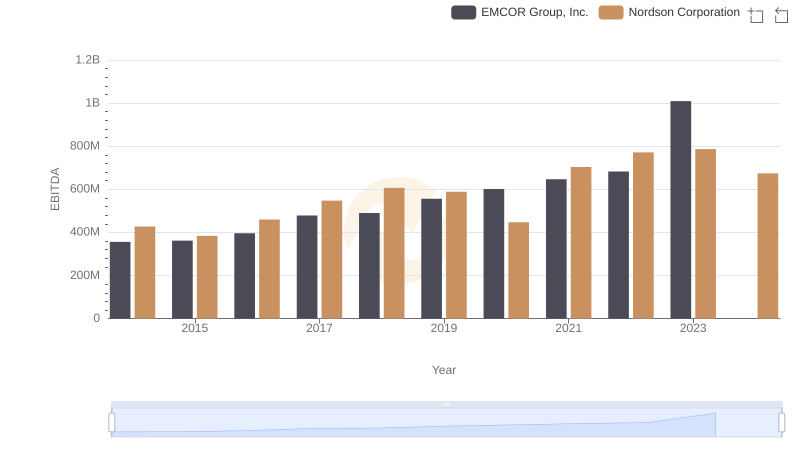
EBITDA Analysis: Evaluating EMCOR Group, Inc. Against Nordson Corporation
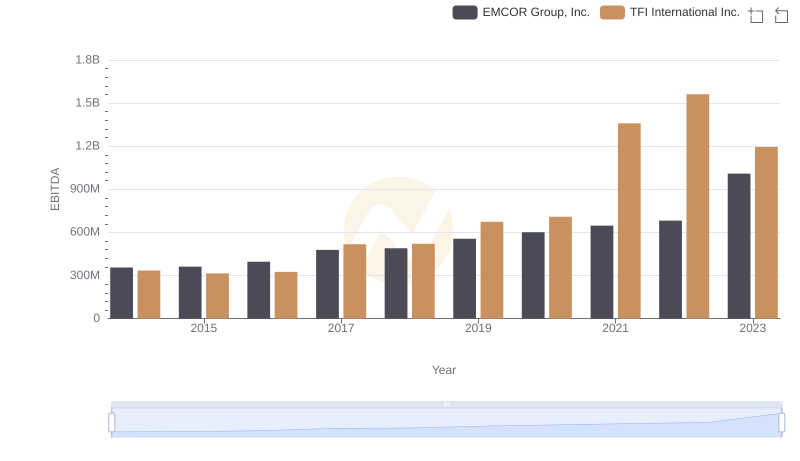
EMCOR Group, Inc. vs TFI International Inc.: In-Depth EBITDA Performance Comparison

EMCOR Group, Inc. and Allegion plc: SG&A Spending Patterns Compared
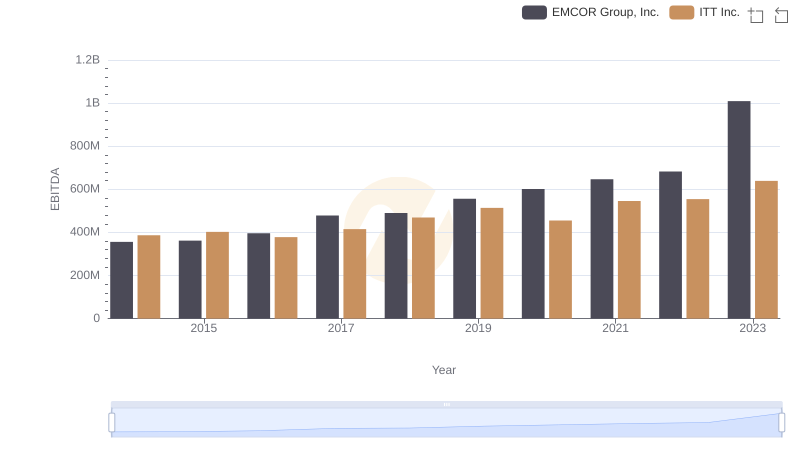
A Side-by-Side Analysis of EBITDA: EMCOR Group, Inc. and ITT Inc.