| __timestamp | Allegion plc | EMCOR Group, Inc. |
|---|---|---|
| Wednesday, January 1, 2014 | 1264600000 | 5517719000 |
| Thursday, January 1, 2015 | 1199000000 | 5774247000 |
| Friday, January 1, 2016 | 1252700000 | 6513662000 |
| Sunday, January 1, 2017 | 1337500000 | 6539987000 |
| Monday, January 1, 2018 | 1558400000 | 6925178000 |
| Tuesday, January 1, 2019 | 1601700000 | 7818743000 |
| Wednesday, January 1, 2020 | 1541100000 | 7401679000 |
| Friday, January 1, 2021 | 1662500000 | 8401843000 |
| Saturday, January 1, 2022 | 1949500000 | 9472526000 |
| Sunday, January 1, 2023 | 2069300000 | 10493534000 |
| Monday, January 1, 2024 | 2103700000 |
Unlocking the unknown
In the ever-evolving landscape of corporate finance, understanding cost structures is pivotal. This analysis delves into the cost of revenue trends for EMCOR Group, Inc. and Allegion plc from 2014 to 2023. Over this decade, EMCOR Group, Inc. has consistently demonstrated a robust growth trajectory, with its cost of revenue surging by approximately 90%, from around $5.5 billion in 2014 to over $10 billion in 2023. In contrast, Allegion plc, while smaller in scale, has also shown a commendable increase of about 64%, rising from $1.26 billion to $2.07 billion in the same period. This data not only highlights the operational scale of these companies but also underscores their strategic financial management. As businesses navigate the complexities of the modern economy, such insights are invaluable for stakeholders aiming to make informed decisions.
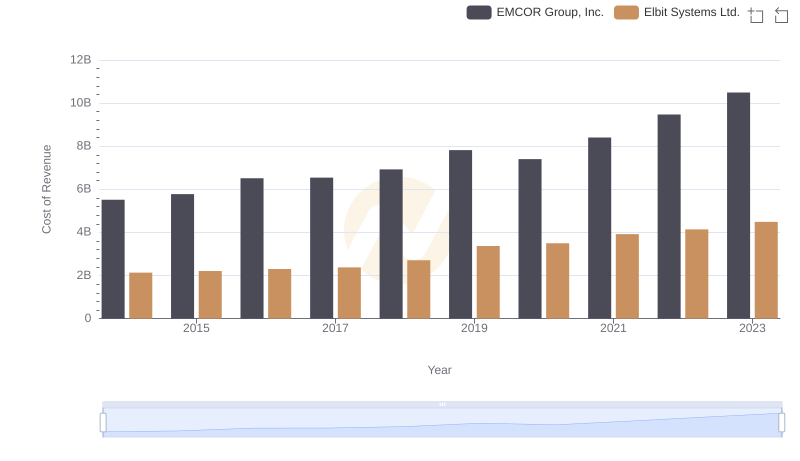
Cost of Revenue Trends: EMCOR Group, Inc. vs Elbit Systems Ltd.
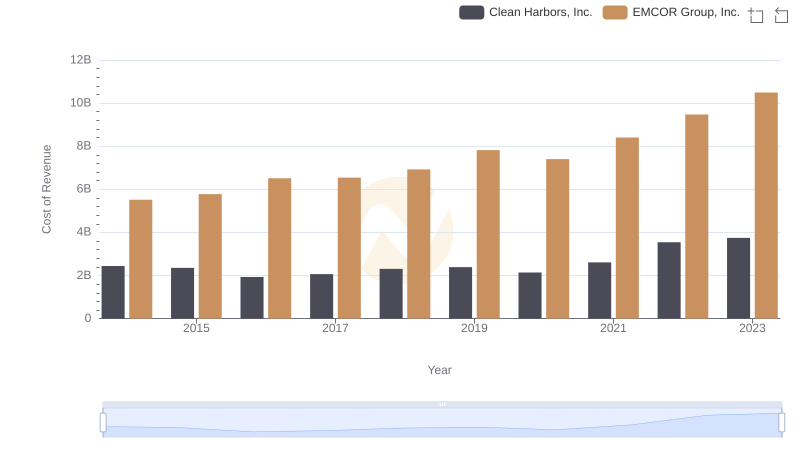
Cost of Revenue Trends: EMCOR Group, Inc. vs Clean Harbors, Inc.
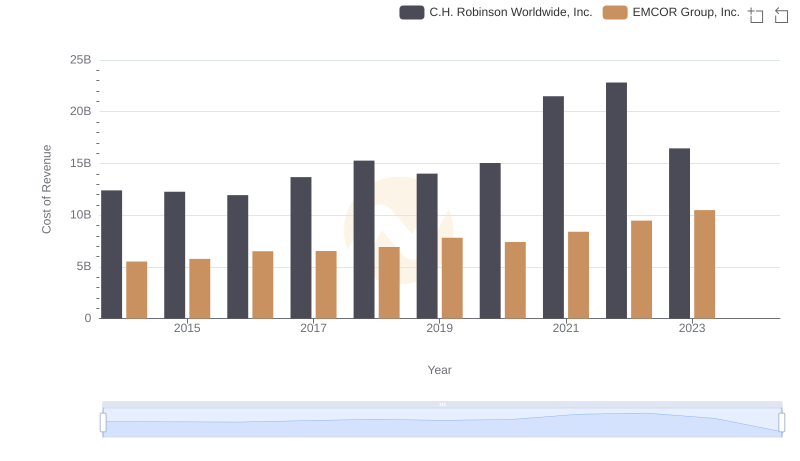
Cost of Revenue Comparison: EMCOR Group, Inc. vs C.H. Robinson Worldwide, Inc.
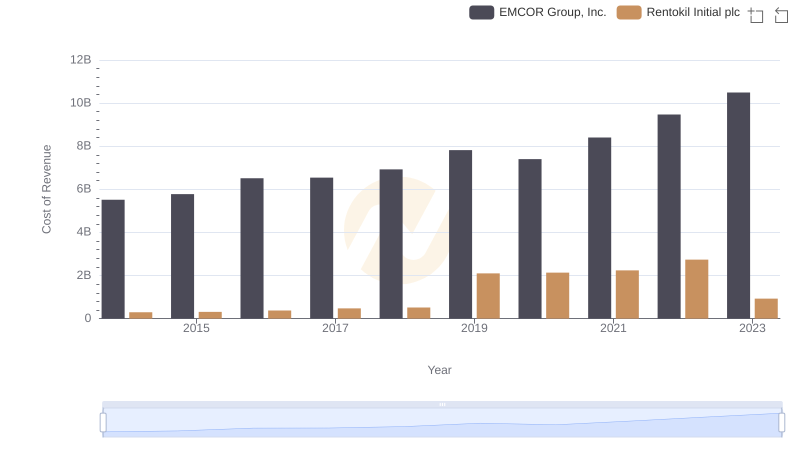
Analyzing Cost of Revenue: EMCOR Group, Inc. and Rentokil Initial plc
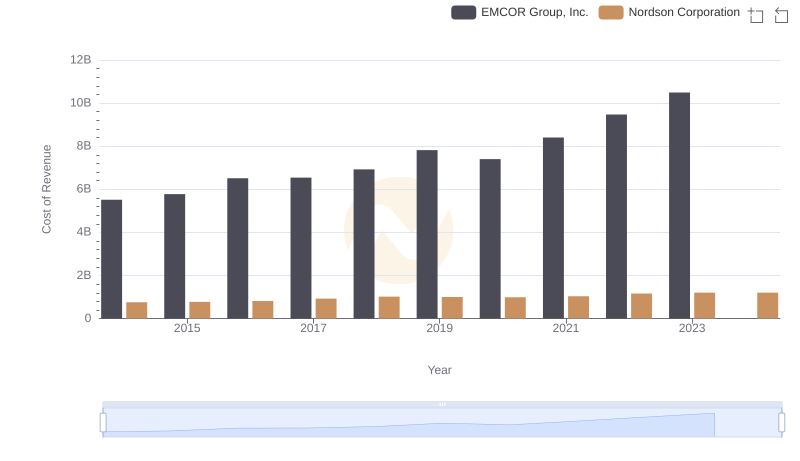
Cost of Revenue: Key Insights for EMCOR Group, Inc. and Nordson Corporation
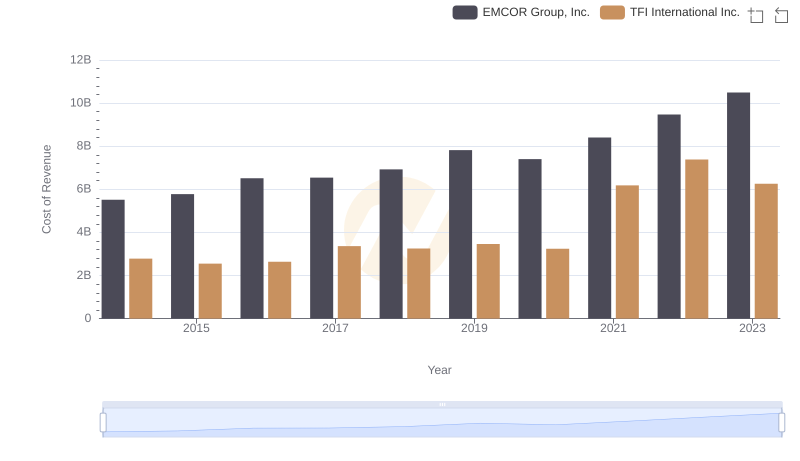
EMCOR Group, Inc. vs TFI International Inc.: Efficiency in Cost of Revenue Explored
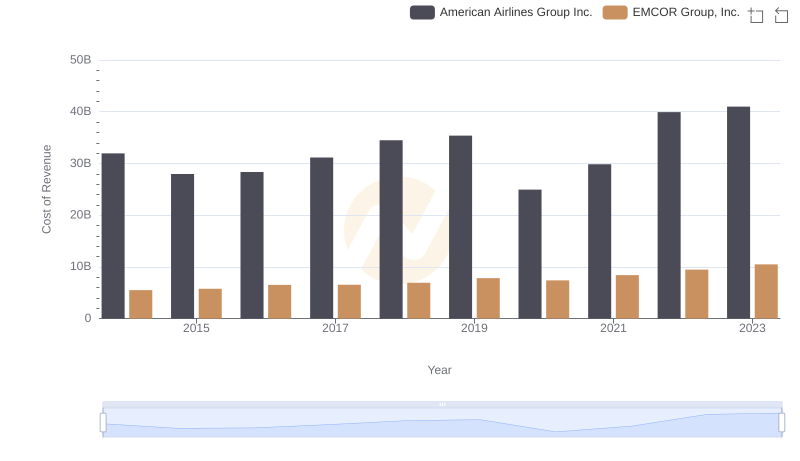
Cost of Revenue: Key Insights for EMCOR Group, Inc. and American Airlines Group Inc.
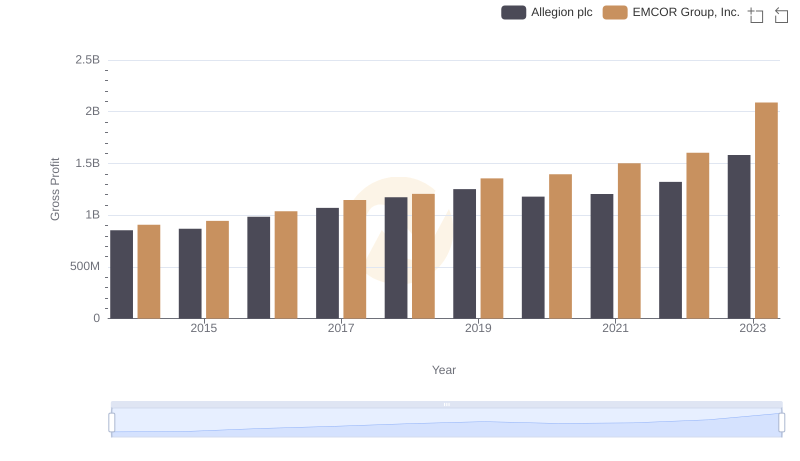
Gross Profit Trends Compared: EMCOR Group, Inc. vs Allegion plc

EMCOR Group, Inc. and Allegion plc: SG&A Spending Patterns Compared
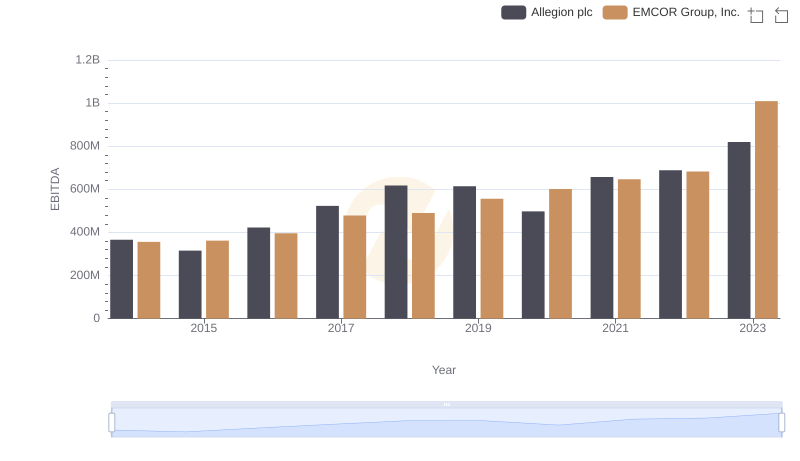
EMCOR Group, Inc. and Allegion plc: A Detailed Examination of EBITDA Performance