| __timestamp | Allegion plc | EMCOR Group, Inc. |
|---|---|---|
| Wednesday, January 1, 2014 | 527400000 | 626478000 |
| Thursday, January 1, 2015 | 510500000 | 656573000 |
| Friday, January 1, 2016 | 559800000 | 725538000 |
| Sunday, January 1, 2017 | 582500000 | 757062000 |
| Monday, January 1, 2018 | 647500000 | 799157000 |
| Tuesday, January 1, 2019 | 687200000 | 893453000 |
| Wednesday, January 1, 2020 | 635700000 | 903584000 |
| Friday, January 1, 2021 | 674700000 | 970937000 |
| Saturday, January 1, 2022 | 736000000 | 1038717000 |
| Sunday, January 1, 2023 | 865600000 | 1211233000 |
| Monday, January 1, 2024 | 887800000 |
Igniting the spark of knowledge
In the ever-evolving landscape of corporate finance, understanding the spending patterns of industry leaders is crucial. EMCOR Group, Inc. and Allegion plc, two giants in their respective fields, have shown distinct trends in their Selling, General, and Administrative (SG&A) expenses over the past decade.
From 2014 to 2023, EMCOR Group, Inc. has consistently outpaced Allegion plc in SG&A spending, with a notable increase of approximately 93% over the period. In 2023, EMCOR's SG&A expenses reached a peak, nearly doubling from their 2014 levels. Allegion plc, while more conservative, also saw a significant rise of around 64% in the same timeframe.
These trends reflect strategic priorities and market positioning. EMCOR's aggressive spending may indicate a focus on expansion and market penetration, while Allegion's steadier increase suggests a more measured approach to growth. Understanding these patterns provides valuable insights into the strategic directions of these companies.
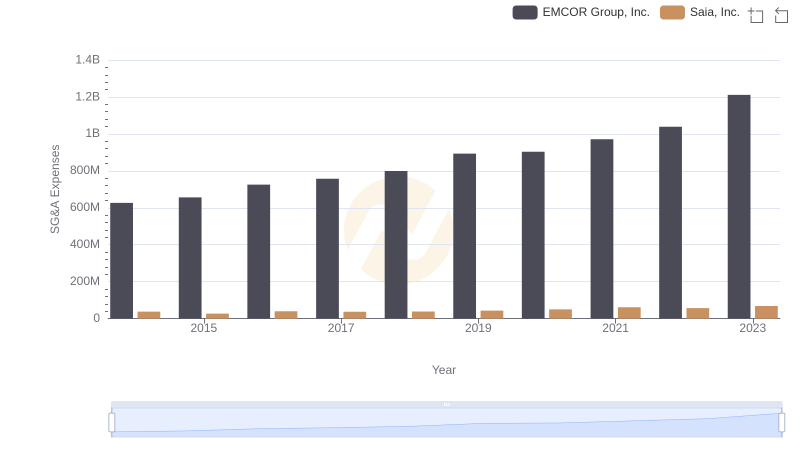
SG&A Efficiency Analysis: Comparing EMCOR Group, Inc. and Saia, Inc.
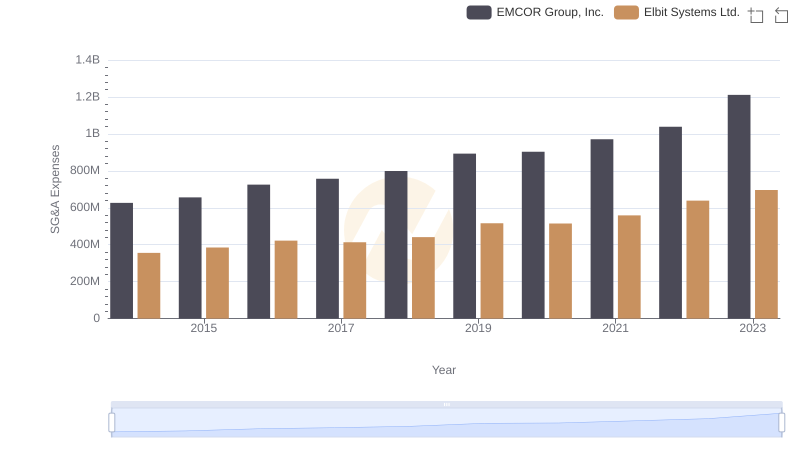
Breaking Down SG&A Expenses: EMCOR Group, Inc. vs Elbit Systems Ltd.
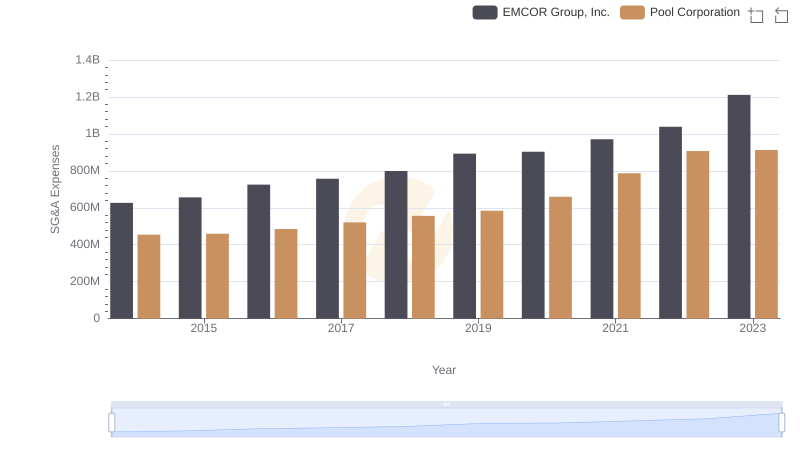
EMCOR Group, Inc. vs Pool Corporation: SG&A Expense Trends
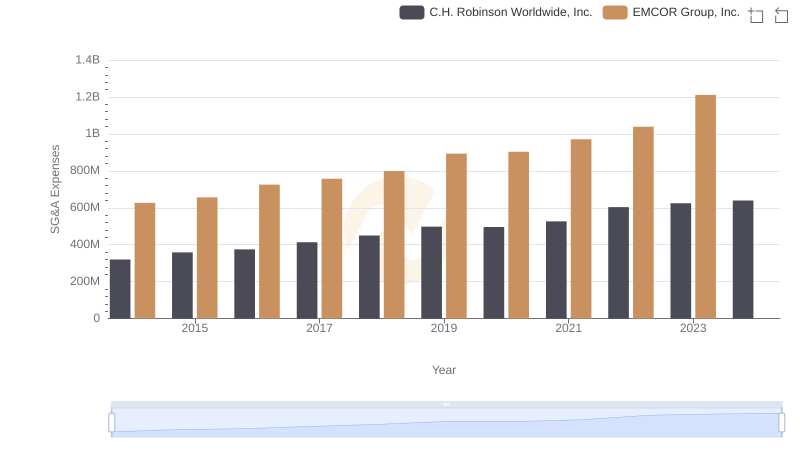
EMCOR Group, Inc. or C.H. Robinson Worldwide, Inc.: Who Manages SG&A Costs Better?
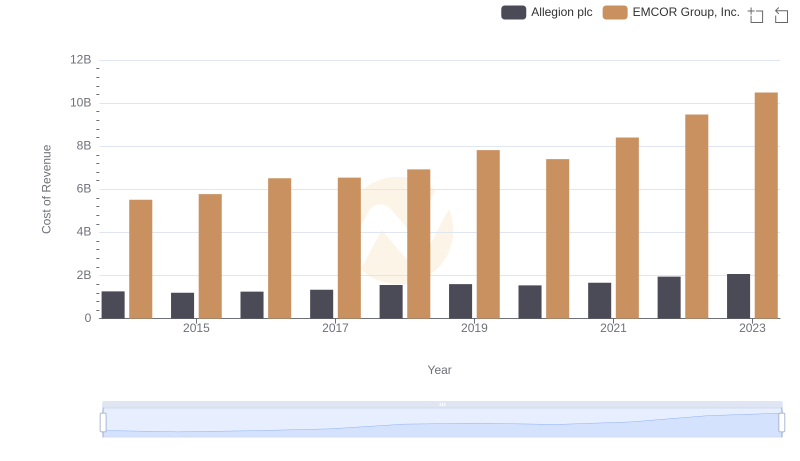
Cost Insights: Breaking Down EMCOR Group, Inc. and Allegion plc's Expenses
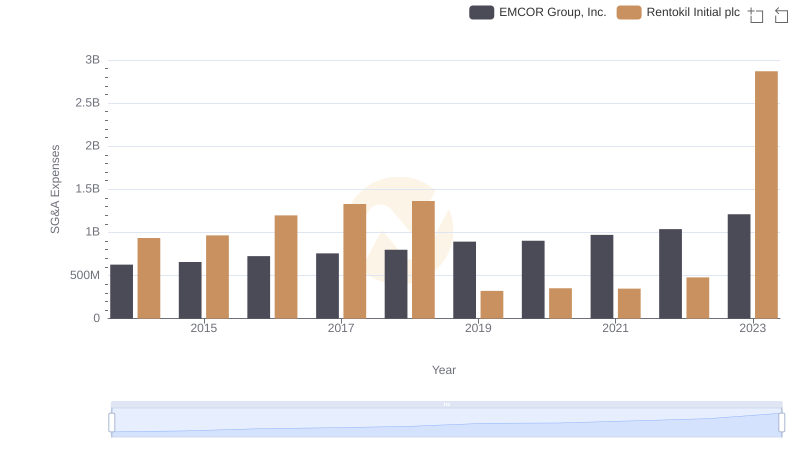
EMCOR Group, Inc. and Rentokil Initial plc: SG&A Spending Patterns Compared
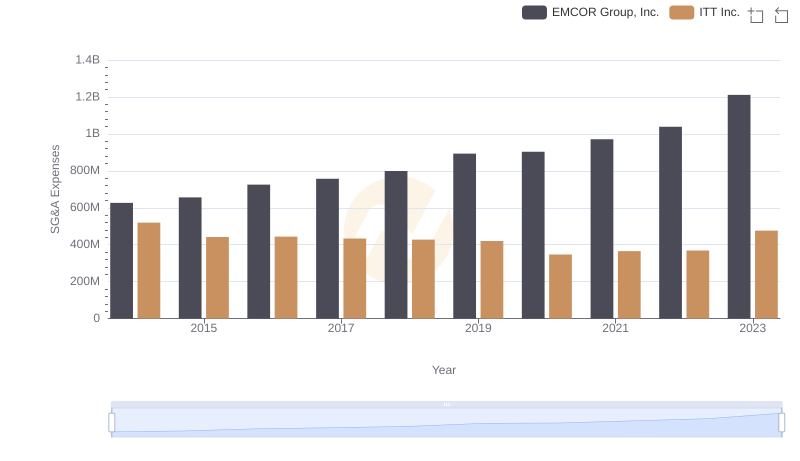
EMCOR Group, Inc. vs ITT Inc.: SG&A Expense Trends
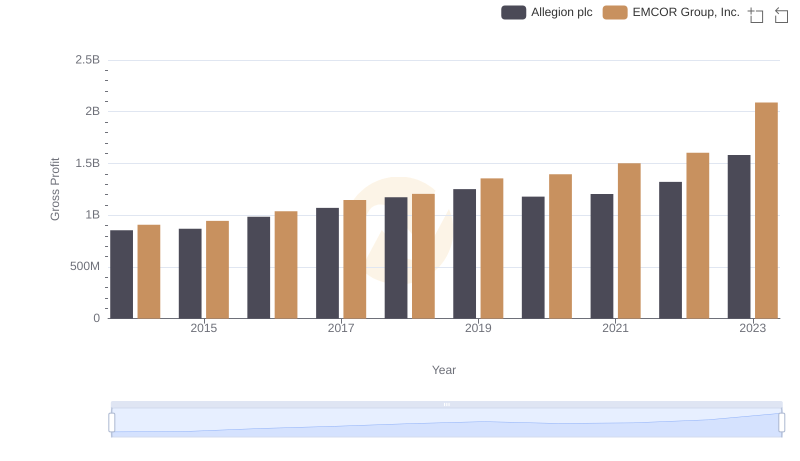
Gross Profit Trends Compared: EMCOR Group, Inc. vs Allegion plc
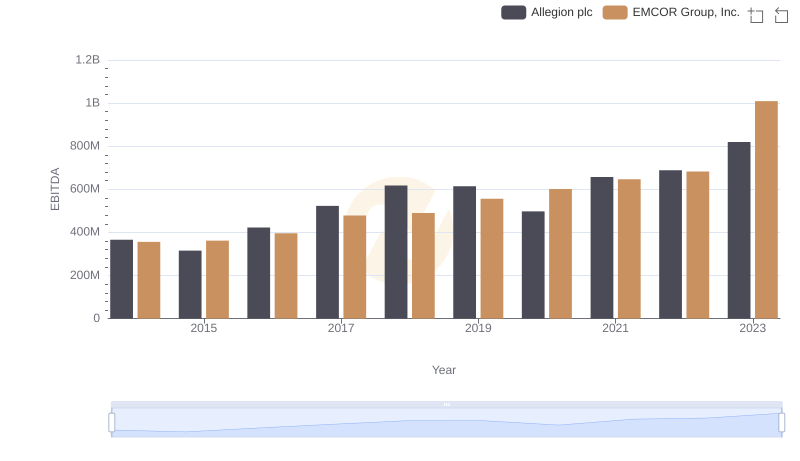
EMCOR Group, Inc. and Allegion plc: A Detailed Examination of EBITDA Performance