| __timestamp | Allegion plc | EMCOR Group, Inc. |
|---|---|---|
| Wednesday, January 1, 2014 | 853700000 | 907246000 |
| Thursday, January 1, 2015 | 869100000 | 944479000 |
| Friday, January 1, 2016 | 985300000 | 1037862000 |
| Sunday, January 1, 2017 | 1070700000 | 1147012000 |
| Monday, January 1, 2018 | 1173300000 | 1205453000 |
| Tuesday, January 1, 2019 | 1252300000 | 1355868000 |
| Wednesday, January 1, 2020 | 1178800000 | 1395382000 |
| Friday, January 1, 2021 | 1204900000 | 1501737000 |
| Saturday, January 1, 2022 | 1322400000 | 1603594000 |
| Sunday, January 1, 2023 | 1581500000 | 2089339000 |
| Monday, January 1, 2024 | 1668500000 |
Cracking the code
In the competitive landscape of the construction and security industries, EMCOR Group, Inc. and Allegion plc have shown remarkable growth in their gross profits over the past decade. From 2014 to 2023, EMCOR Group, Inc. has consistently outperformed Allegion plc, with a notable 130% increase in gross profit, peaking at over $2 billion in 2023. Allegion plc, while trailing, has also demonstrated a robust growth trajectory, achieving a 85% increase, reaching approximately $1.6 billion in the same year.
These trends highlight the dynamic nature of these industries and the companies' ability to adapt and thrive in changing market conditions.
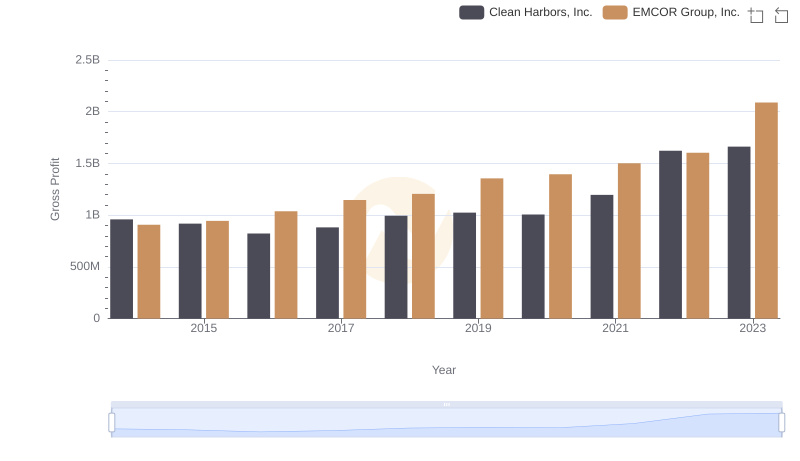
EMCOR Group, Inc. and Clean Harbors, Inc.: A Detailed Gross Profit Analysis
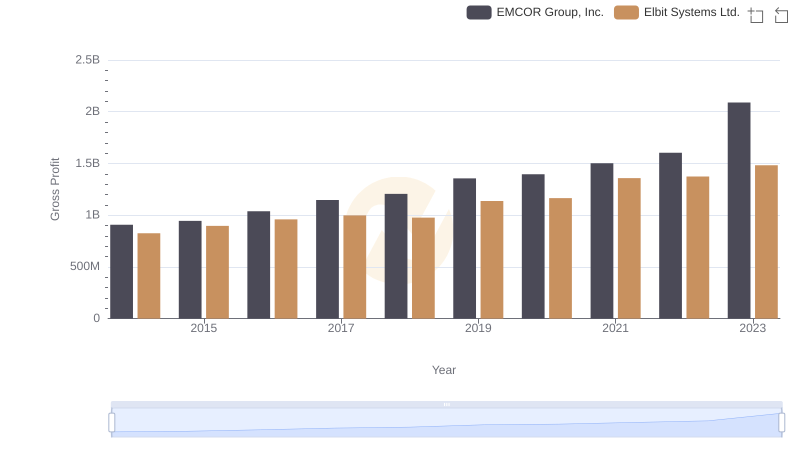
EMCOR Group, Inc. vs Elbit Systems Ltd.: A Gross Profit Performance Breakdown
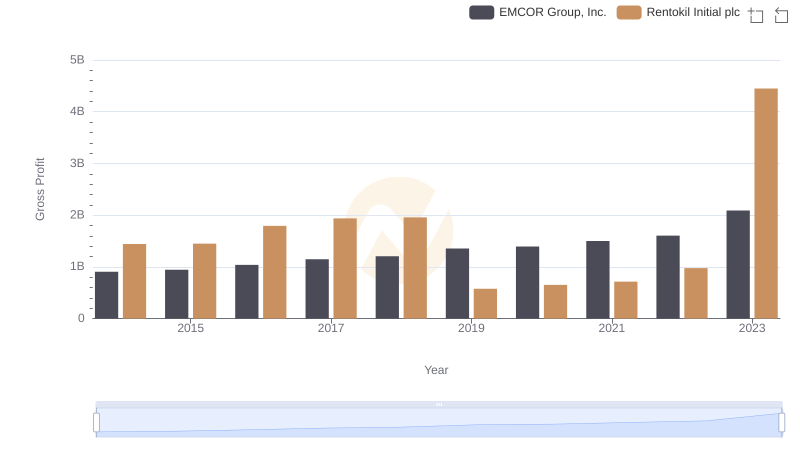
Who Generates Higher Gross Profit? EMCOR Group, Inc. or Rentokil Initial plc
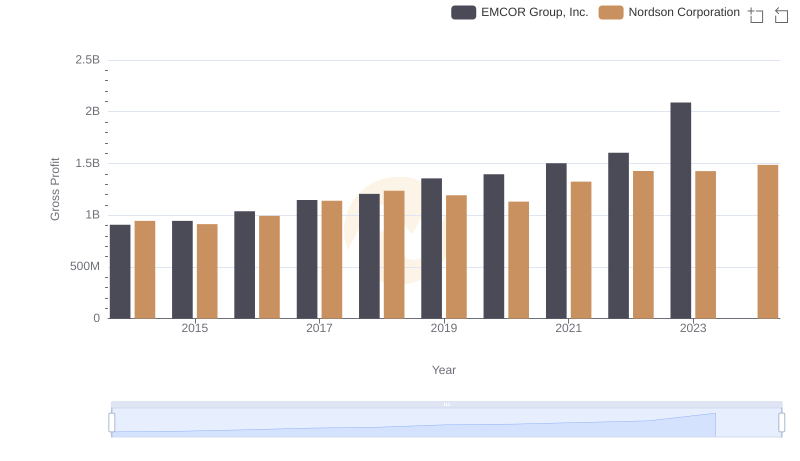
Key Insights on Gross Profit: EMCOR Group, Inc. vs Nordson Corporation
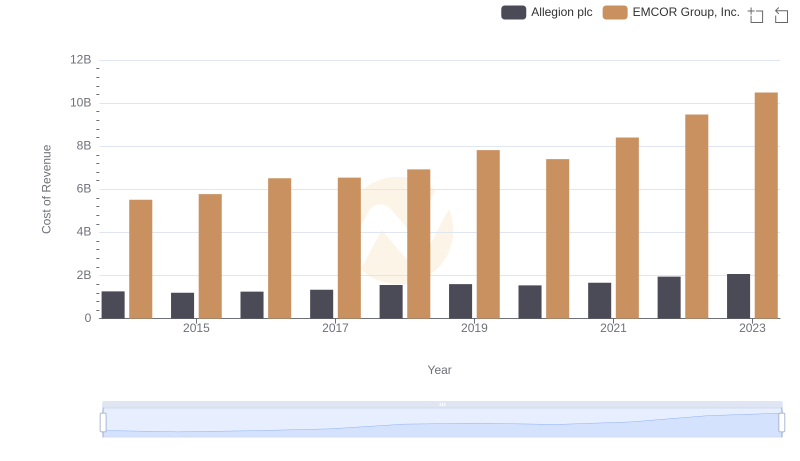
Cost Insights: Breaking Down EMCOR Group, Inc. and Allegion plc's Expenses
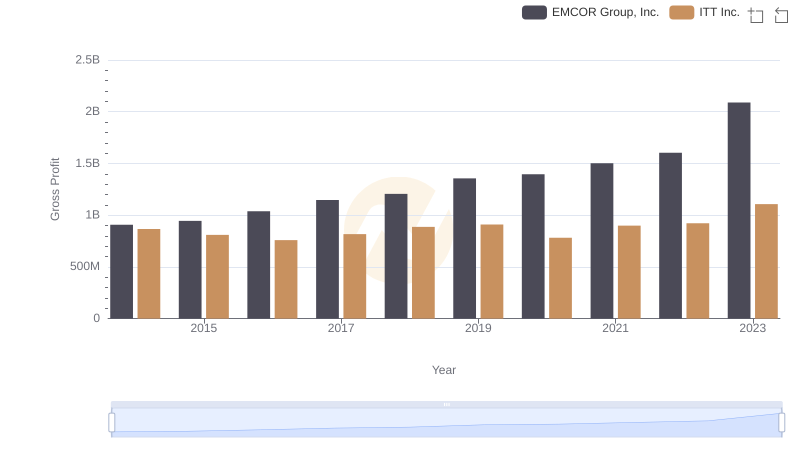
Who Generates Higher Gross Profit? EMCOR Group, Inc. or ITT Inc.
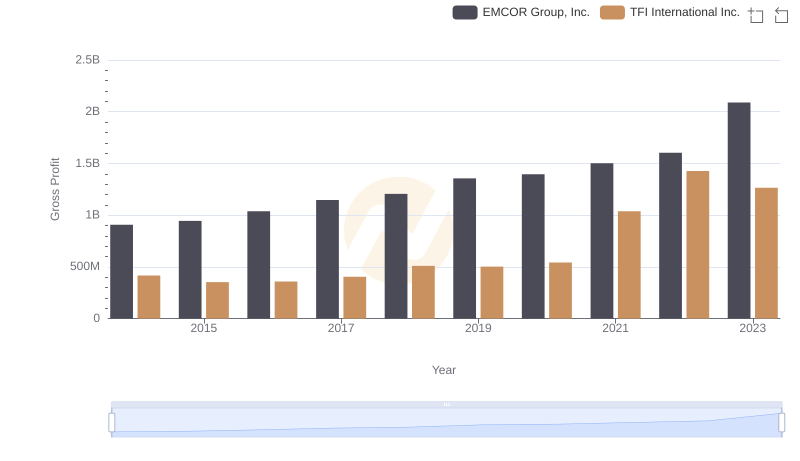
Gross Profit Analysis: Comparing EMCOR Group, Inc. and TFI International Inc.

EMCOR Group, Inc. and Allegion plc: SG&A Spending Patterns Compared
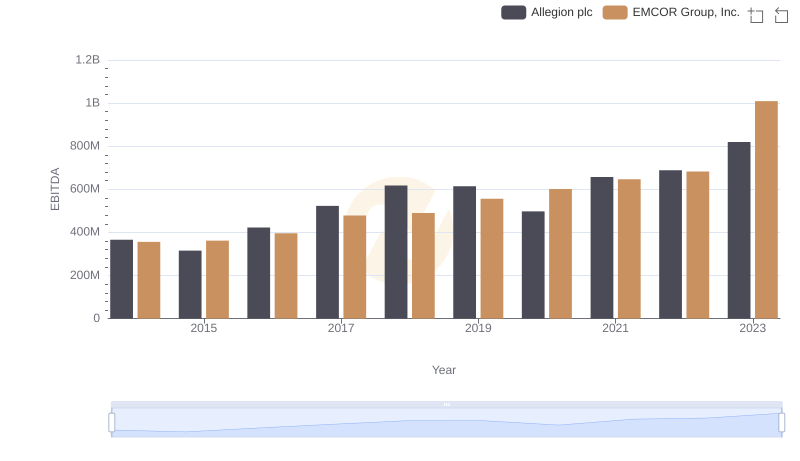
EMCOR Group, Inc. and Allegion plc: A Detailed Examination of EBITDA Performance