| __timestamp | W.W. Grainger, Inc. | Waste Management, Inc. |
|---|---|---|
| Wednesday, January 1, 2014 | 1552805000 | 3509000000 |
| Thursday, January 1, 2015 | 1512243000 | 3342000000 |
| Friday, January 1, 2016 | 1334247000 | 3713000000 |
| Sunday, January 1, 2017 | 1284000000 | 3996000000 |
| Monday, January 1, 2018 | 1423000000 | 4212000000 |
| Tuesday, January 1, 2019 | 1516000000 | 4344000000 |
| Wednesday, January 1, 2020 | 1216000000 | 4149000000 |
| Friday, January 1, 2021 | 1738000000 | 4956000000 |
| Saturday, January 1, 2022 | 2404000000 | 5466000000 |
| Sunday, January 1, 2023 | 2807000000 | 5592000000 |
| Monday, January 1, 2024 | 2637000000 | 5128000000 |
Data in motion
In the ever-evolving landscape of corporate finance, EBITDA serves as a crucial indicator of a company's operational efficiency. Over the past decade, Waste Management, Inc. and W.W. Grainger, Inc. have demonstrated contrasting trajectories in their EBITDA performance. From 2014 to 2023, Waste Management, Inc. has consistently outperformed its counterpart, showcasing a robust growth of approximately 60% in EBITDA, peaking at $5.6 billion in 2023. In contrast, W.W. Grainger, Inc. experienced a more volatile journey, with a notable surge of 130% from 2020 to 2023, reaching $2.8 billion. This divergence highlights Waste Management's steady operational prowess, while Grainger's recent uptick suggests strategic shifts or market adaptations. As we delve into these financial narratives, the data underscores the importance of strategic resilience and adaptability in maintaining competitive advantage.
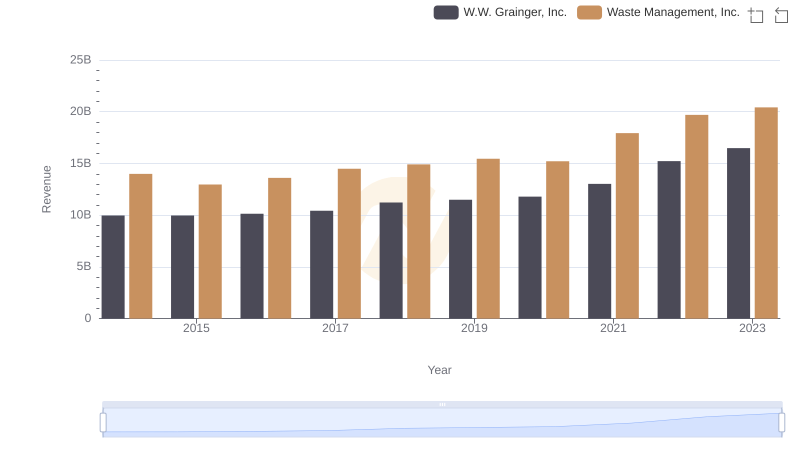
Breaking Down Revenue Trends: Waste Management, Inc. vs W.W. Grainger, Inc.
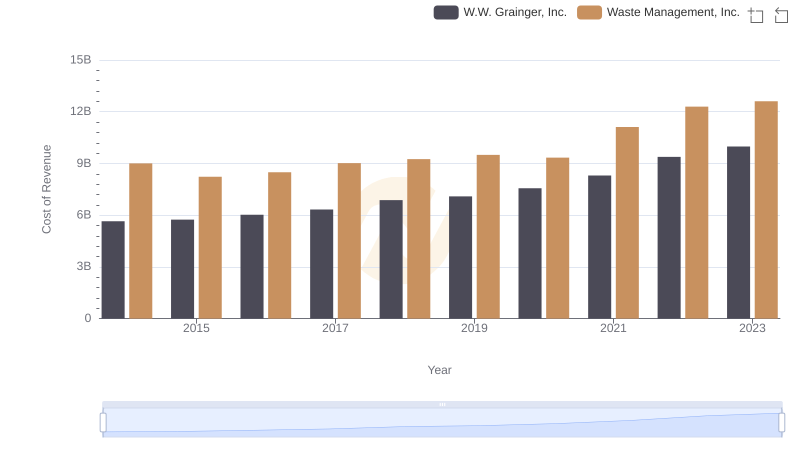
Waste Management, Inc. vs W.W. Grainger, Inc.: Efficiency in Cost of Revenue Explored
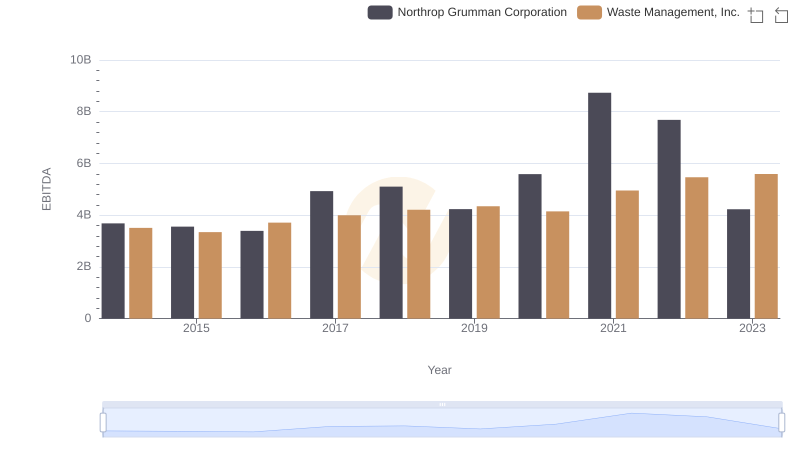
Waste Management, Inc. and Northrop Grumman Corporation: A Detailed Examination of EBITDA Performance
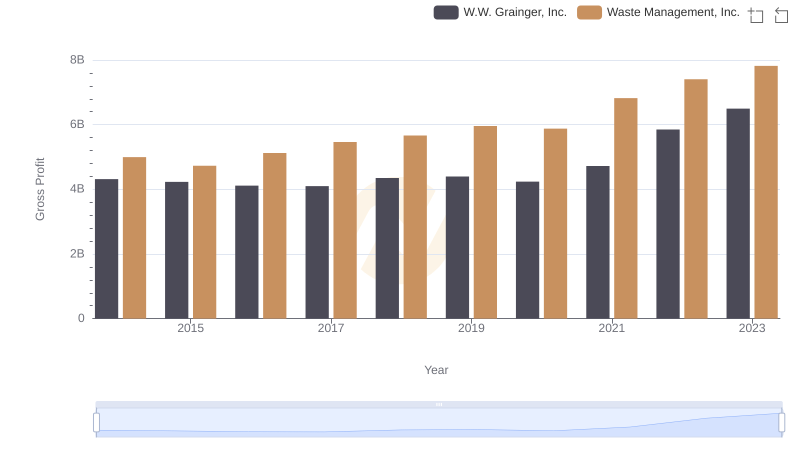
Gross Profit Trends Compared: Waste Management, Inc. vs W.W. Grainger, Inc.
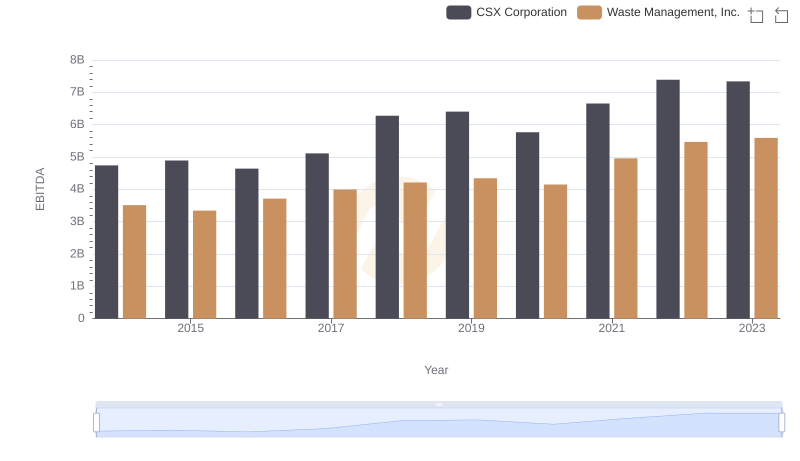
A Professional Review of EBITDA: Waste Management, Inc. Compared to CSX Corporation
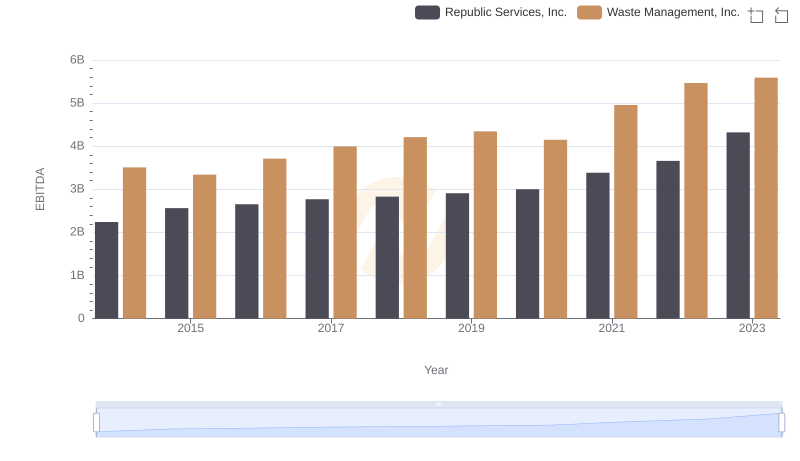
EBITDA Metrics Evaluated: Waste Management, Inc. vs Republic Services, Inc.
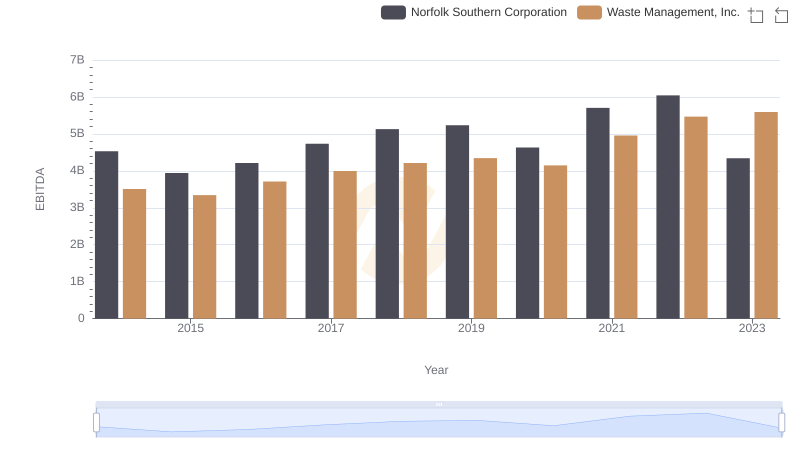
Waste Management, Inc. and Norfolk Southern Corporation: A Detailed Examination of EBITDA Performance
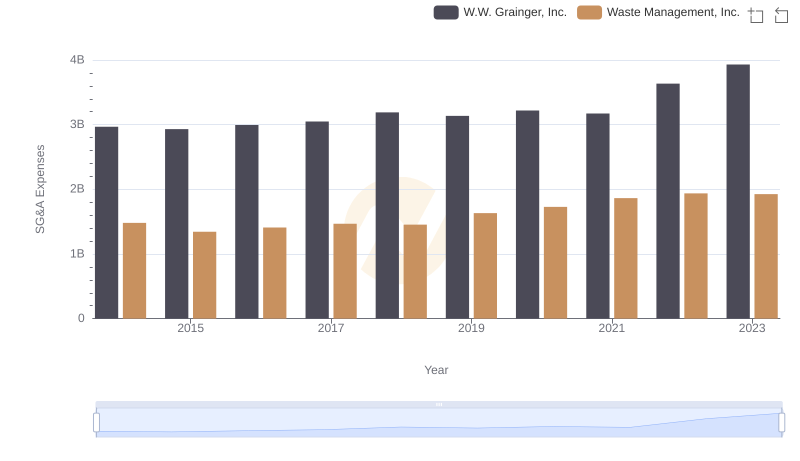
Waste Management, Inc. and W.W. Grainger, Inc.: SG&A Spending Patterns Compared
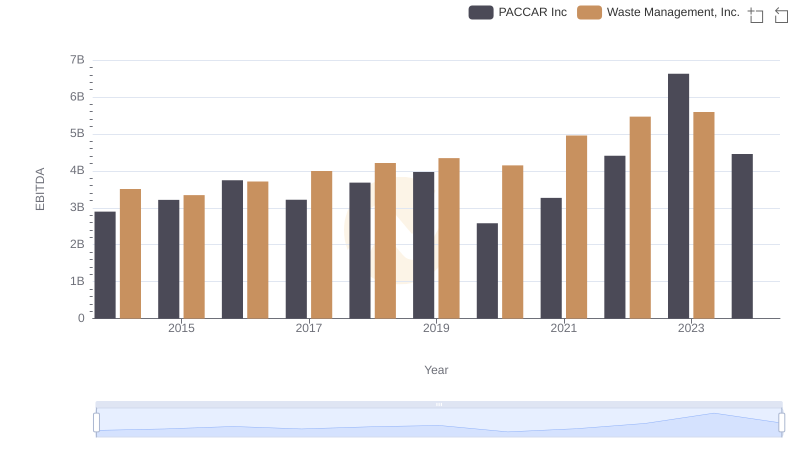
Comprehensive EBITDA Comparison: Waste Management, Inc. vs PACCAR Inc

Professional EBITDA Benchmarking: Waste Management, Inc. vs Roper Technologies, Inc.
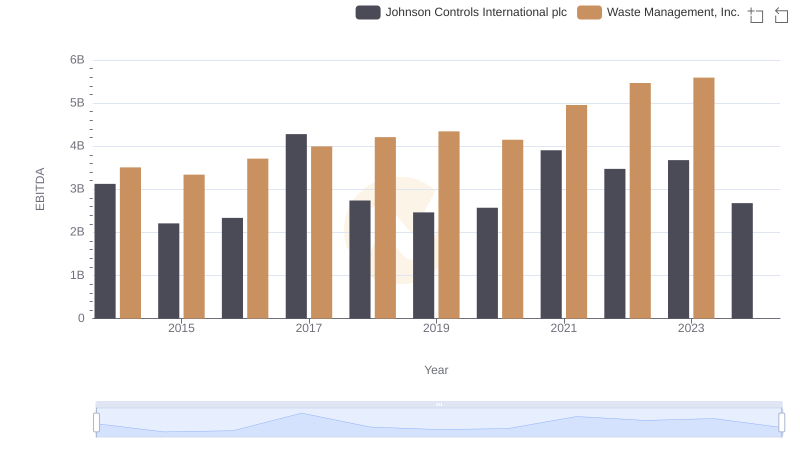
EBITDA Metrics Evaluated: Waste Management, Inc. vs Johnson Controls International plc