| __timestamp | W.W. Grainger, Inc. | Waste Management, Inc. |
|---|---|---|
| Wednesday, January 1, 2014 | 9964953000 | 13996000000 |
| Thursday, January 1, 2015 | 9973384000 | 12961000000 |
| Friday, January 1, 2016 | 10137204000 | 13609000000 |
| Sunday, January 1, 2017 | 10424858000 | 14485000000 |
| Monday, January 1, 2018 | 11221000000 | 14914000000 |
| Tuesday, January 1, 2019 | 11486000000 | 15455000000 |
| Wednesday, January 1, 2020 | 11797000000 | 15218000000 |
| Friday, January 1, 2021 | 13022000000 | 17931000000 |
| Saturday, January 1, 2022 | 15228000000 | 19698000000 |
| Sunday, January 1, 2023 | 16478000000 | 20426000000 |
| Monday, January 1, 2024 | 17168000000 | 22063000000 |
Unlocking the unknown
In the past decade, Waste Management, Inc. and W.W. Grainger, Inc. have showcased remarkable revenue growth, reflecting their strategic prowess in their respective industries. Waste Management, Inc., a leader in waste services, has seen its revenue soar by approximately 46% from 2014 to 2023, reaching over $20 billion. This growth underscores the increasing demand for sustainable waste solutions. Meanwhile, W.W. Grainger, Inc., a key player in industrial supply, has experienced a 65% revenue increase, highlighting its resilience and adaptability in a competitive market.
Both companies have demonstrated consistent upward trends, with Waste Management, Inc. maintaining a steady climb and W.W. Grainger, Inc. accelerating its growth post-2020. This data not only reflects their financial health but also their ability to adapt to changing market dynamics, making them formidable entities in their sectors.

Revenue Showdown: Waste Management, Inc. vs Roper Technologies, Inc.
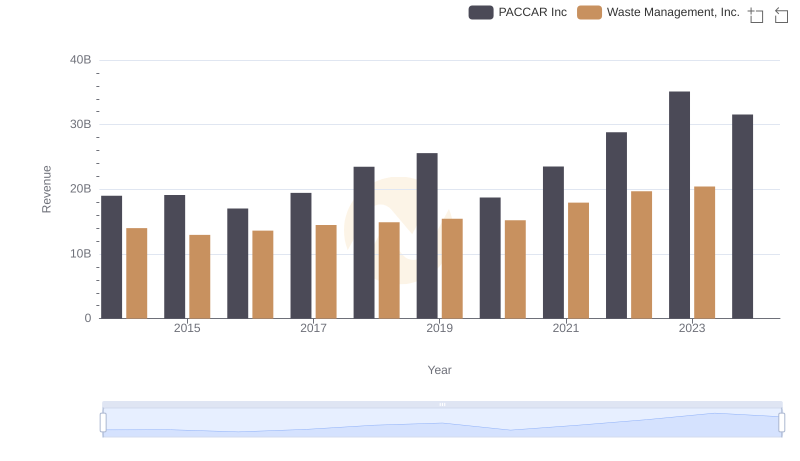
Waste Management, Inc. vs PACCAR Inc: Examining Key Revenue Metrics
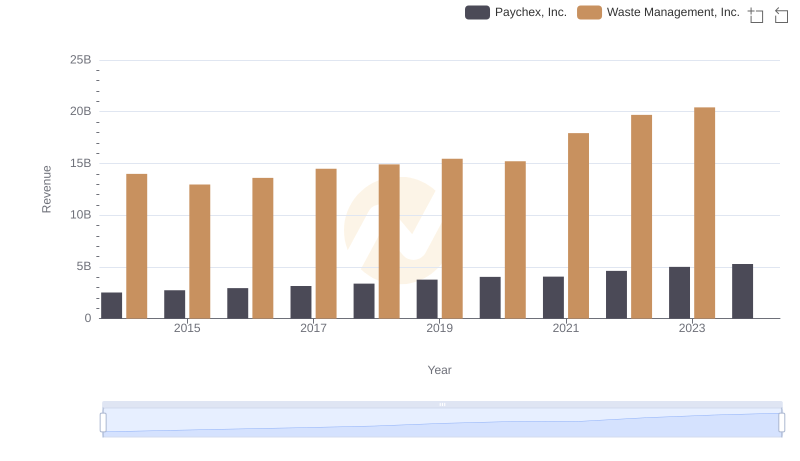
Comparing Revenue Performance: Waste Management, Inc. or Paychex, Inc.?
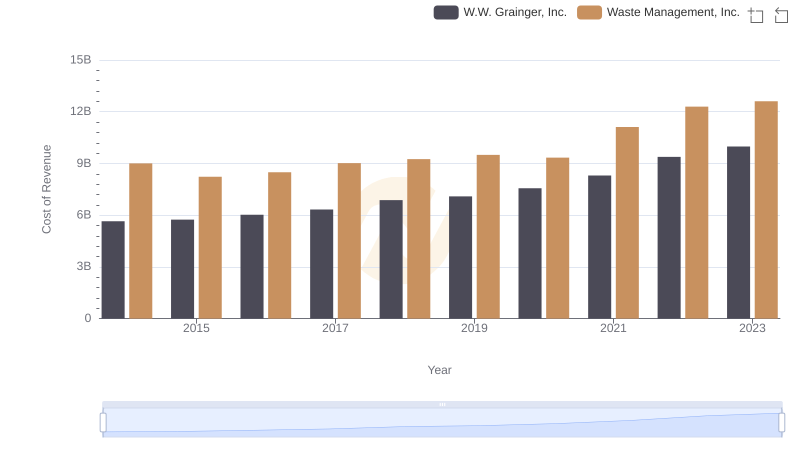
Waste Management, Inc. vs W.W. Grainger, Inc.: Efficiency in Cost of Revenue Explored

Comparing Revenue Performance: Waste Management, Inc. or Johnson Controls International plc?
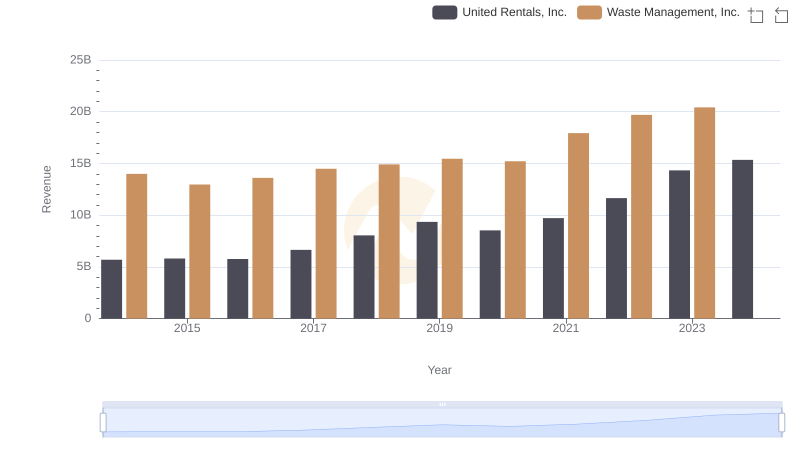
Annual Revenue Comparison: Waste Management, Inc. vs United Rentals, Inc.
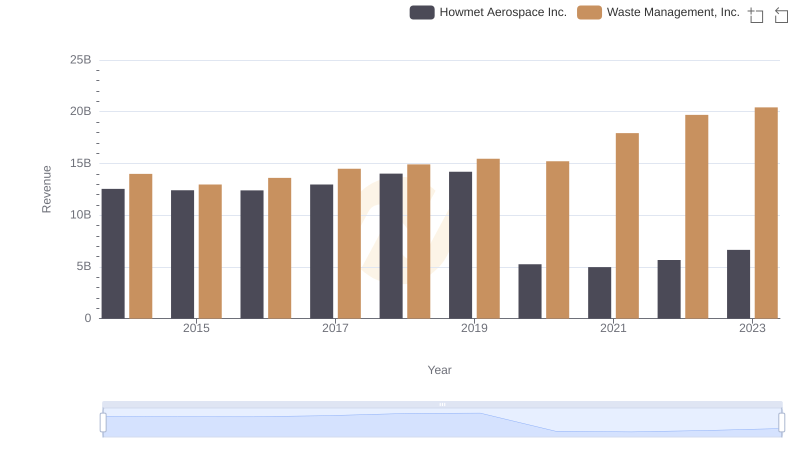
Waste Management, Inc. or Howmet Aerospace Inc.: Who Leads in Yearly Revenue?
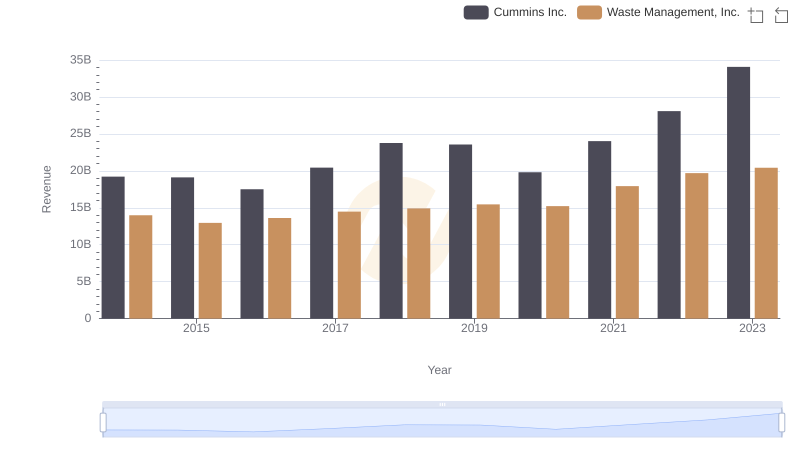
Waste Management, Inc. vs Cummins Inc.: Examining Key Revenue Metrics
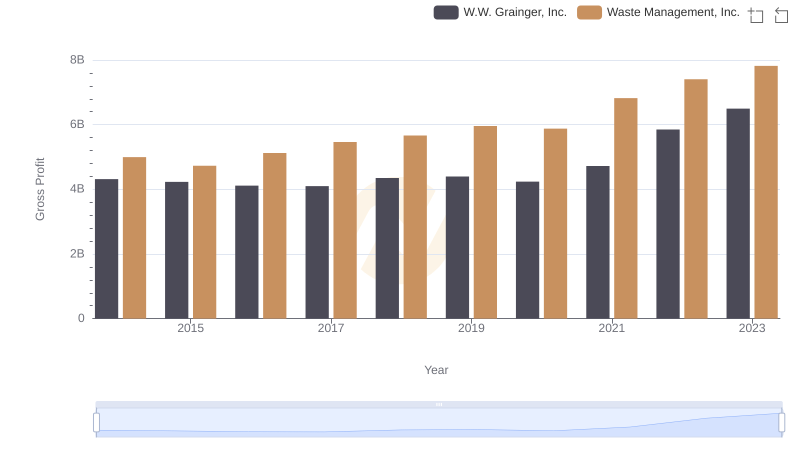
Gross Profit Trends Compared: Waste Management, Inc. vs W.W. Grainger, Inc.
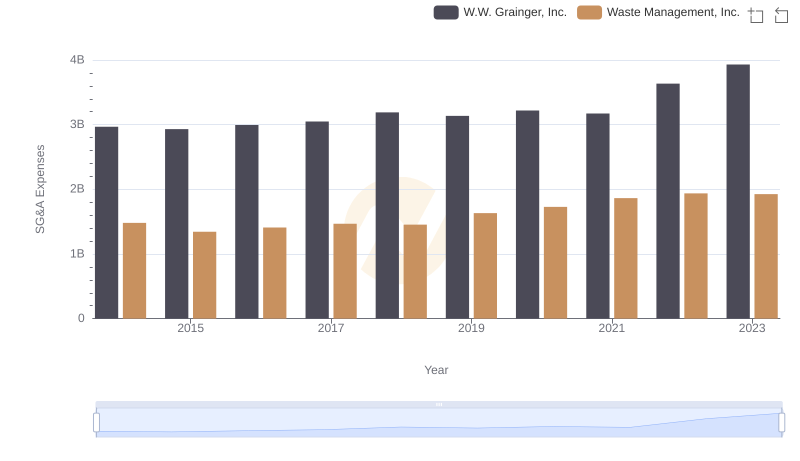
Waste Management, Inc. and W.W. Grainger, Inc.: SG&A Spending Patterns Compared
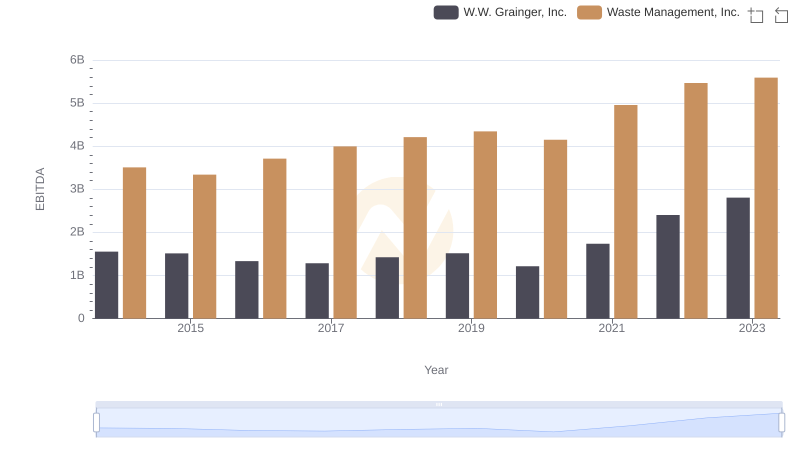
EBITDA Performance Review: Waste Management, Inc. vs W.W. Grainger, Inc.