| __timestamp | W.W. Grainger, Inc. | Waste Management, Inc. |
|---|---|---|
| Wednesday, January 1, 2014 | 4314242000 | 4994000000 |
| Thursday, January 1, 2015 | 4231428000 | 4730000000 |
| Friday, January 1, 2016 | 4114557000 | 5123000000 |
| Sunday, January 1, 2017 | 4097557000 | 5464000000 |
| Monday, January 1, 2018 | 4348000000 | 5665000000 |
| Tuesday, January 1, 2019 | 4397000000 | 5959000000 |
| Wednesday, January 1, 2020 | 4238000000 | 5877000000 |
| Friday, January 1, 2021 | 4720000000 | 6820000000 |
| Saturday, January 1, 2022 | 5849000000 | 7404000000 |
| Sunday, January 1, 2023 | 6496000000 | 7820000000 |
| Monday, January 1, 2024 | 6758000000 | 8680000000 |
Unveiling the hidden dimensions of data
In the ever-evolving landscape of American industry, Waste Management, Inc. and W.W. Grainger, Inc. have demonstrated remarkable resilience and growth over the past decade. From 2014 to 2023, Waste Management's gross profit surged by approximately 57%, reflecting its robust adaptation to environmental challenges and increasing demand for sustainable waste solutions. Meanwhile, W.W. Grainger, a leader in industrial supply, saw its gross profit rise by nearly 51%, underscoring its strategic expansion and innovation in supply chain solutions.
Waste Management consistently outperformed W.W. Grainger, with a gross profit peaking at $7.82 billion in 2023, compared to Grainger's $6.50 billion. This trend highlights Waste Management's dominant position in the waste management sector, driven by its commitment to sustainability and efficiency. As these companies continue to innovate, their financial trajectories offer valuable insights into the future of their respective industries.
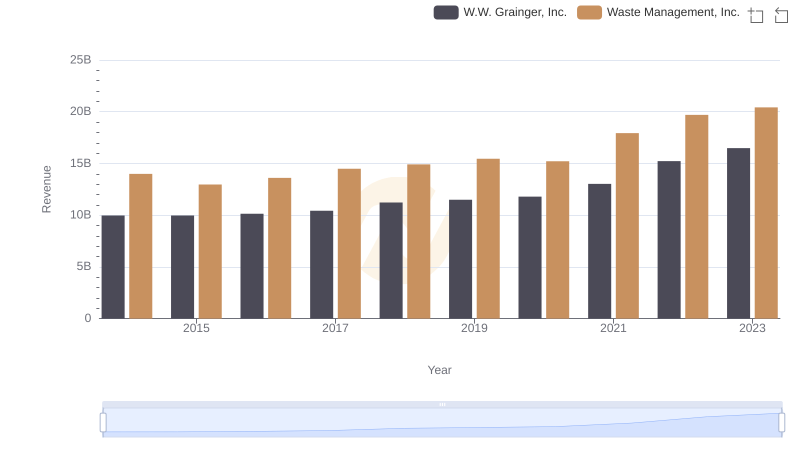
Breaking Down Revenue Trends: Waste Management, Inc. vs W.W. Grainger, Inc.
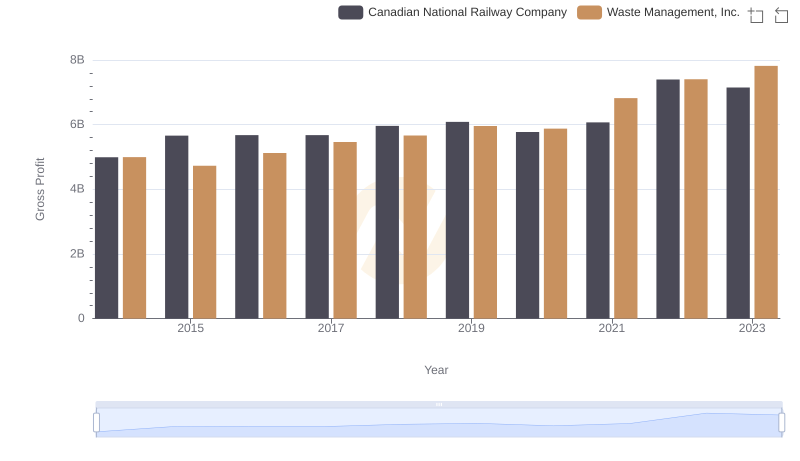
Who Generates Higher Gross Profit? Waste Management, Inc. or Canadian National Railway Company
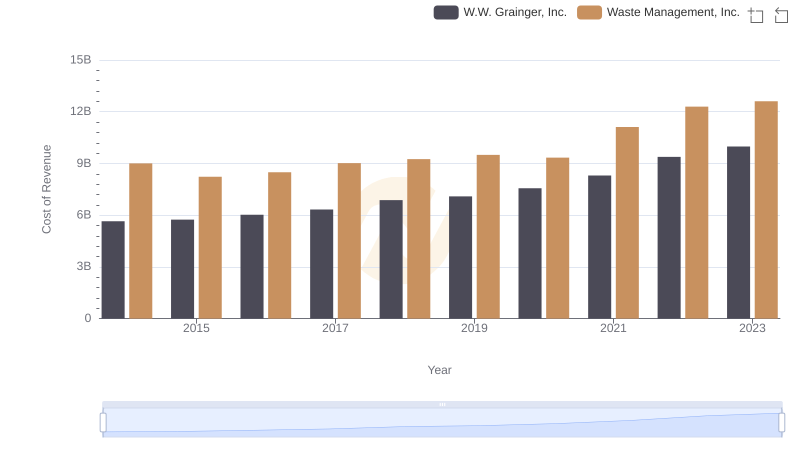
Waste Management, Inc. vs W.W. Grainger, Inc.: Efficiency in Cost of Revenue Explored
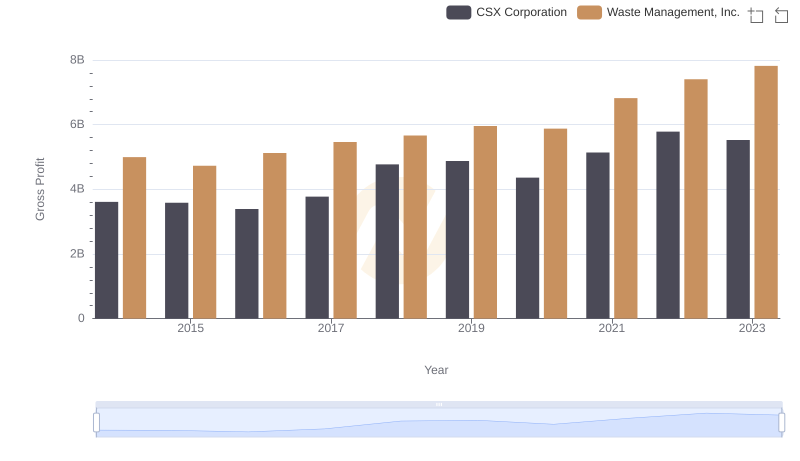
Waste Management, Inc. vs CSX Corporation: A Gross Profit Performance Breakdown
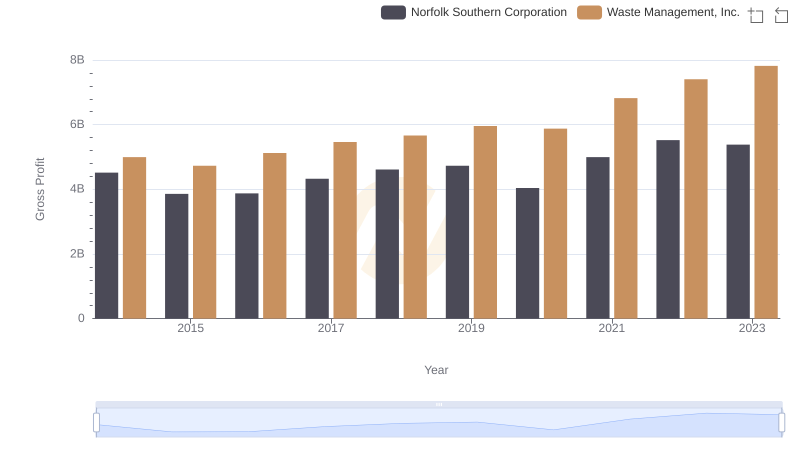
Gross Profit Analysis: Comparing Waste Management, Inc. and Norfolk Southern Corporation
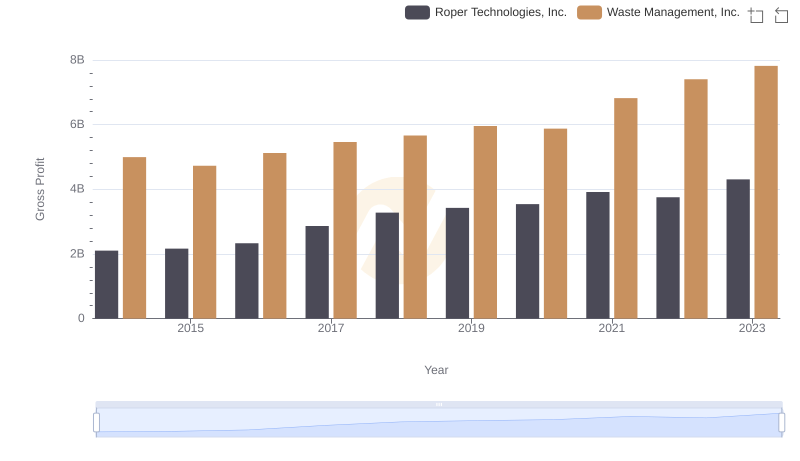
Who Generates Higher Gross Profit? Waste Management, Inc. or Roper Technologies, Inc.
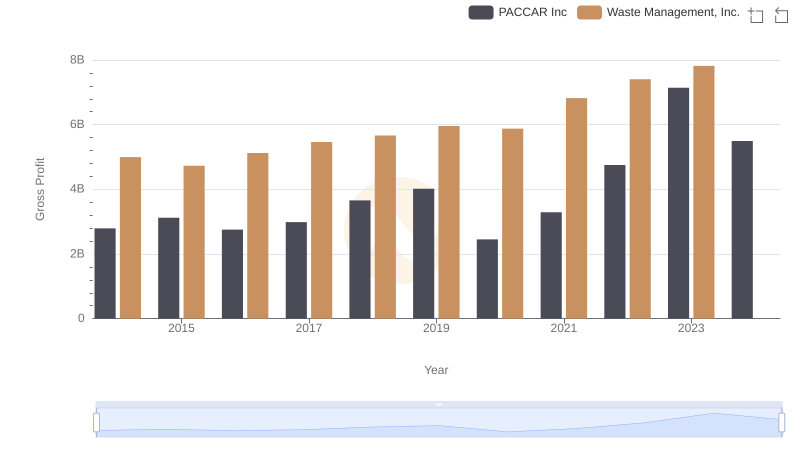
Key Insights on Gross Profit: Waste Management, Inc. vs PACCAR Inc
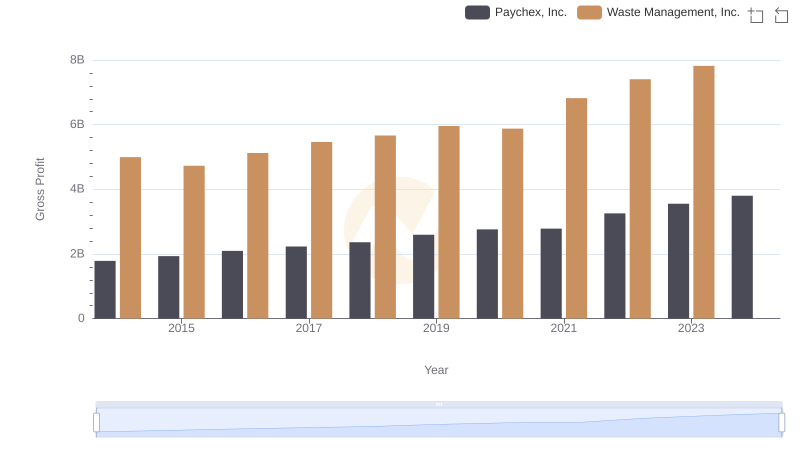
Gross Profit Comparison: Waste Management, Inc. and Paychex, Inc. Trends
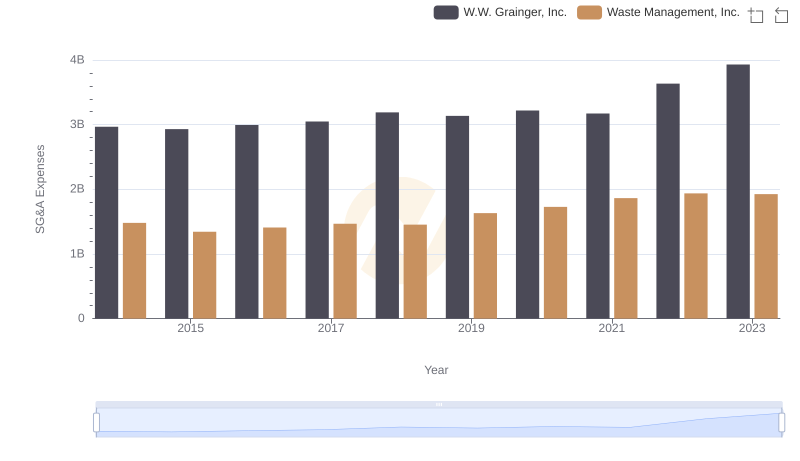
Waste Management, Inc. and W.W. Grainger, Inc.: SG&A Spending Patterns Compared
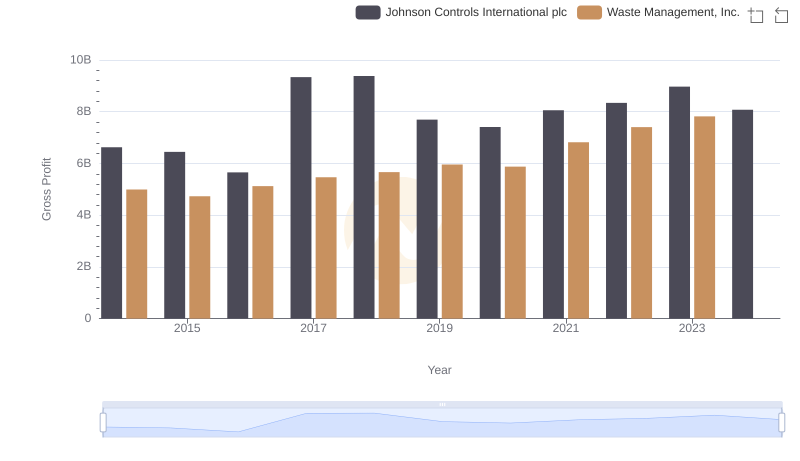
Waste Management, Inc. and Johnson Controls International plc: A Detailed Gross Profit Analysis
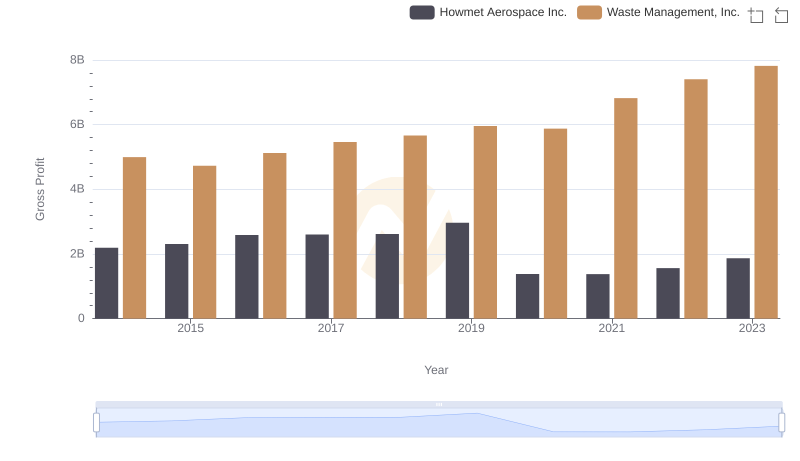
Gross Profit Comparison: Waste Management, Inc. and Howmet Aerospace Inc. Trends
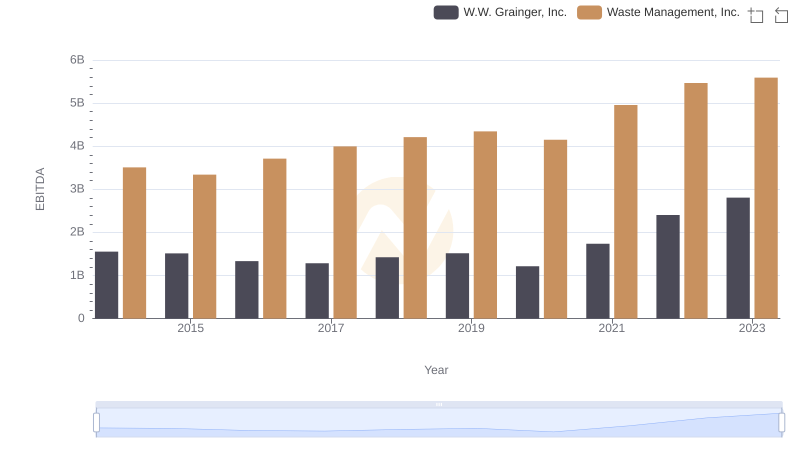
EBITDA Performance Review: Waste Management, Inc. vs W.W. Grainger, Inc.