| __timestamp | W.W. Grainger, Inc. | Waste Management, Inc. |
|---|---|---|
| Wednesday, January 1, 2014 | 2967125000 | 1481000000 |
| Thursday, January 1, 2015 | 2931108000 | 1343000000 |
| Friday, January 1, 2016 | 2995060000 | 1410000000 |
| Sunday, January 1, 2017 | 3048895000 | 1468000000 |
| Monday, January 1, 2018 | 3190000000 | 1453000000 |
| Tuesday, January 1, 2019 | 3135000000 | 1631000000 |
| Wednesday, January 1, 2020 | 3219000000 | 1728000000 |
| Friday, January 1, 2021 | 3173000000 | 1864000000 |
| Saturday, January 1, 2022 | 3634000000 | 1938000000 |
| Sunday, January 1, 2023 | 3931000000 | 1926000000 |
| Monday, January 1, 2024 | 4121000000 | 2264000000 |
Infusing magic into the data realm
In the world of corporate finance, understanding the nuances of Selling, General, and Administrative (SG&A) expenses is crucial. Over the past decade, W.W. Grainger, Inc. and Waste Management, Inc. have showcased distinct spending patterns. From 2014 to 2023, W.W. Grainger's SG&A expenses surged by approximately 32%, peaking at nearly $3.9 billion in 2023. In contrast, Waste Management's expenses grew by about 30%, reaching close to $1.9 billion in the same year. This divergence highlights Grainger's aggressive expansion strategy compared to Waste Management's steady growth. Notably, both companies experienced a significant uptick in 2022, reflecting broader economic trends. As businesses navigate the complexities of operational costs, these insights offer a window into strategic financial management. Dive deeper into the data to explore how these industry leaders balance growth and efficiency.
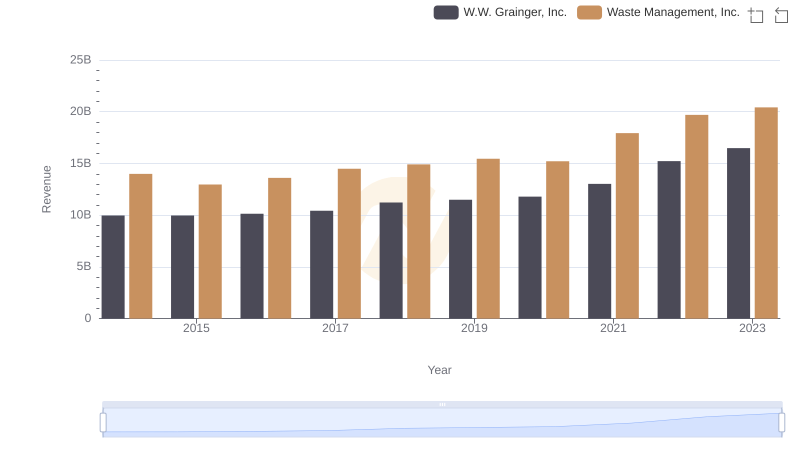
Breaking Down Revenue Trends: Waste Management, Inc. vs W.W. Grainger, Inc.
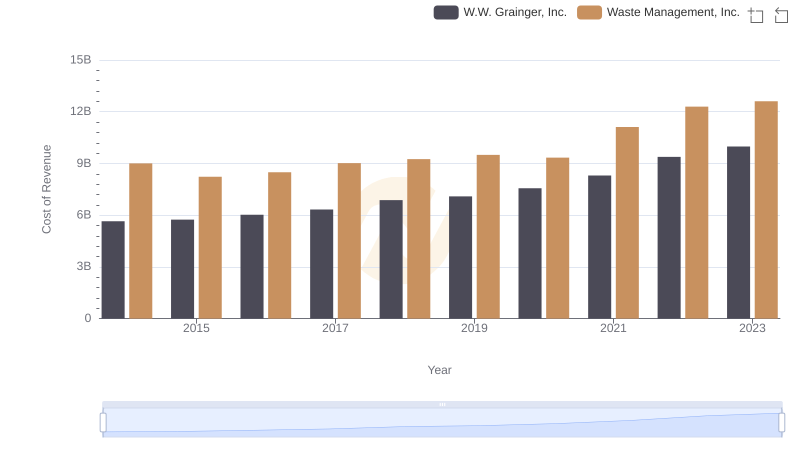
Waste Management, Inc. vs W.W. Grainger, Inc.: Efficiency in Cost of Revenue Explored

Breaking Down SG&A Expenses: Waste Management, Inc. vs Republic Services, Inc.
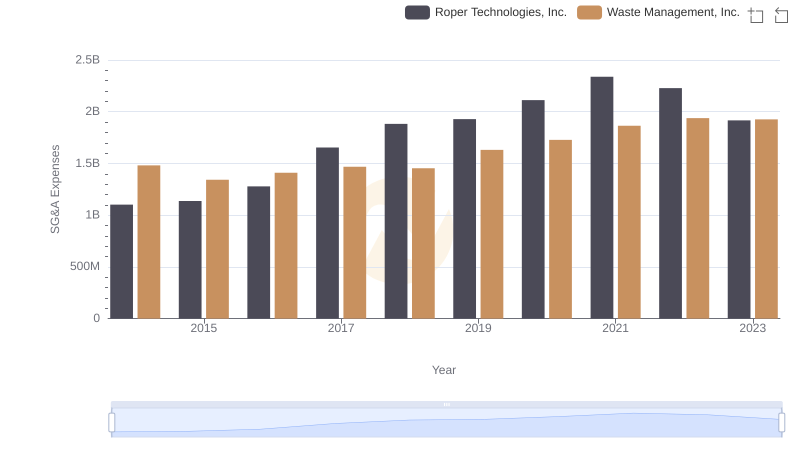
Who Optimizes SG&A Costs Better? Waste Management, Inc. or Roper Technologies, Inc.
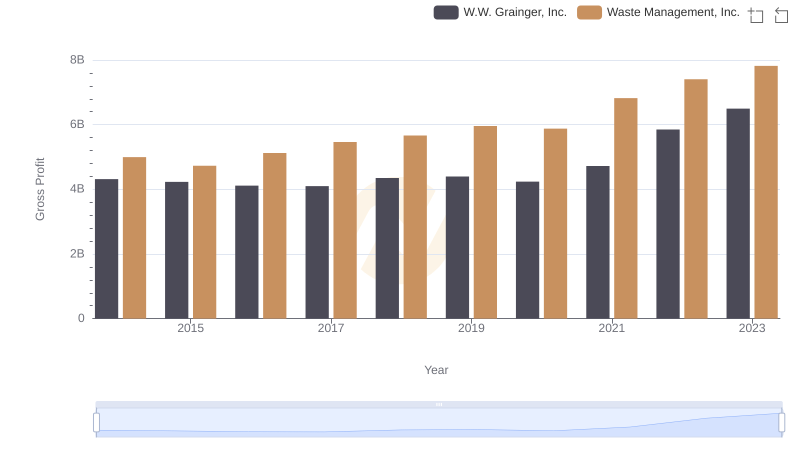
Gross Profit Trends Compared: Waste Management, Inc. vs W.W. Grainger, Inc.
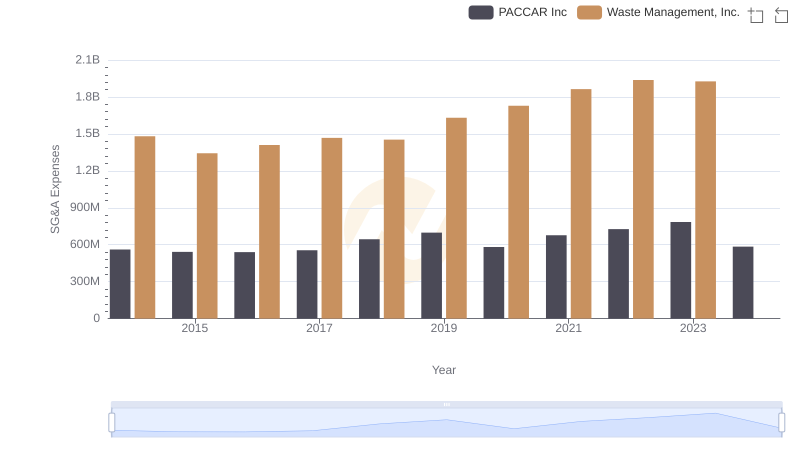
Waste Management, Inc. and PACCAR Inc: SG&A Spending Patterns Compared
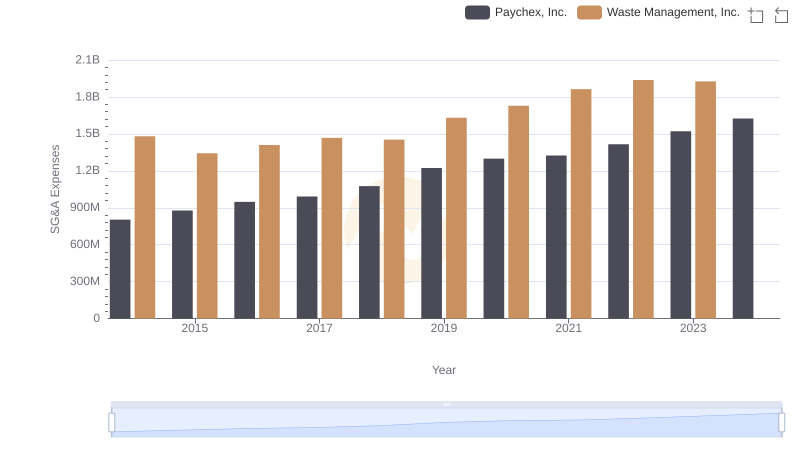
Waste Management, Inc. or Paychex, Inc.: Who Manages SG&A Costs Better?
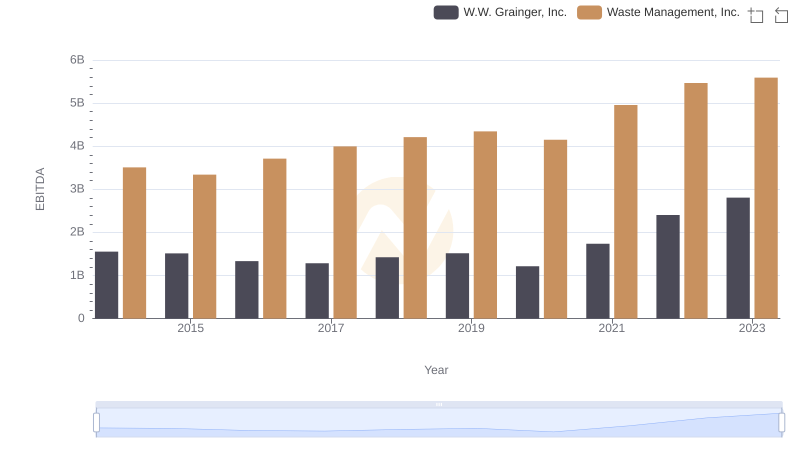
EBITDA Performance Review: Waste Management, Inc. vs W.W. Grainger, Inc.
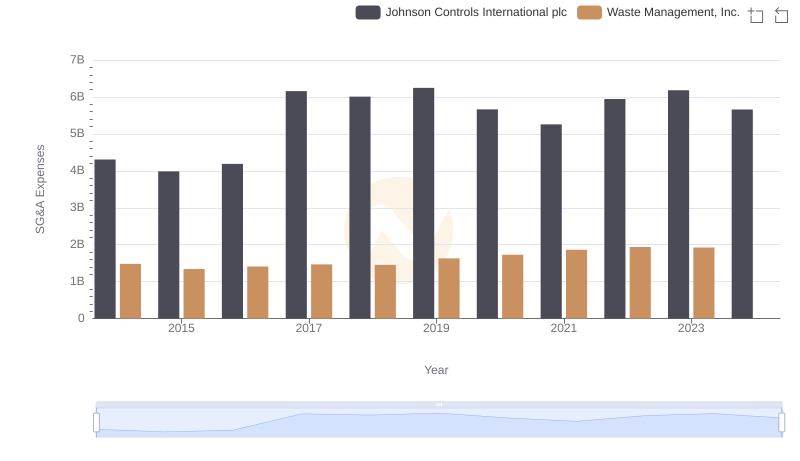
Waste Management, Inc. and Johnson Controls International plc: SG&A Spending Patterns Compared
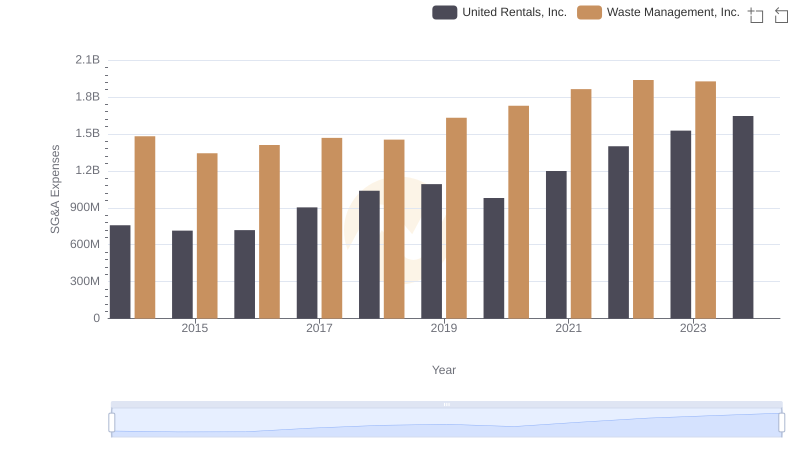
Selling, General, and Administrative Costs: Waste Management, Inc. vs United Rentals, Inc.
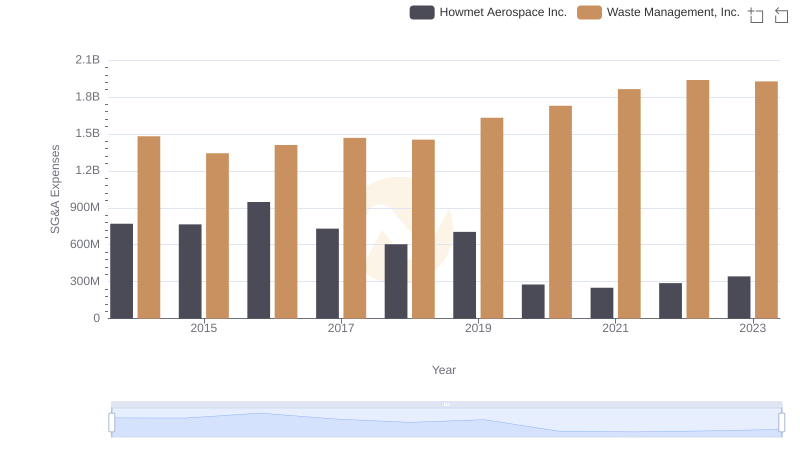
Cost Management Insights: SG&A Expenses for Waste Management, Inc. and Howmet Aerospace Inc.