| __timestamp | Norfolk Southern Corporation | Waste Management, Inc. |
|---|---|---|
| Wednesday, January 1, 2014 | 4531000000 | 3509000000 |
| Thursday, January 1, 2015 | 3943000000 | 3342000000 |
| Friday, January 1, 2016 | 4212000000 | 3713000000 |
| Sunday, January 1, 2017 | 4733000000 | 3996000000 |
| Monday, January 1, 2018 | 5128000000 | 4212000000 |
| Tuesday, January 1, 2019 | 5233000000 | 4344000000 |
| Wednesday, January 1, 2020 | 4632000000 | 4149000000 |
| Friday, January 1, 2021 | 5705000000 | 4956000000 |
| Saturday, January 1, 2022 | 6043000000 | 5466000000 |
| Sunday, January 1, 2023 | 4340000000 | 5592000000 |
| Monday, January 1, 2024 | 4071000000 | 5128000000 |
Igniting the spark of knowledge
In the ever-evolving landscape of American industry, Waste Management, Inc. and Norfolk Southern Corporation stand as titans in their respective fields. From 2014 to 2023, these companies have showcased intriguing trends in their EBITDA performance, a key indicator of financial health.
Waste Management, Inc. has demonstrated a robust upward trajectory, with EBITDA growing approximately 59% over the decade. This growth reflects the company's strategic investments and operational efficiencies. In contrast, Norfolk Southern Corporation experienced a more volatile journey, with a peak in 2022 followed by a notable decline in 2023, dropping by nearly 28% from its high.
These trends highlight the dynamic nature of the transportation and waste management sectors, offering valuable insights for investors and industry analysts alike. As we look to the future, understanding these patterns will be crucial for navigating the complexities of these industries.
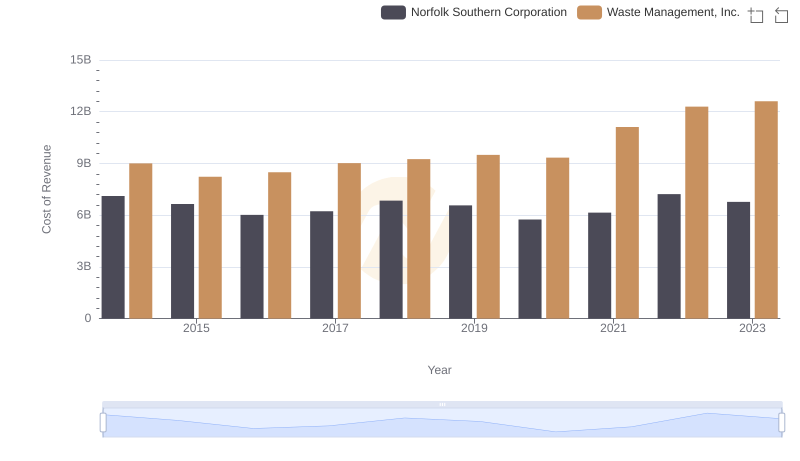
Analyzing Cost of Revenue: Waste Management, Inc. and Norfolk Southern Corporation
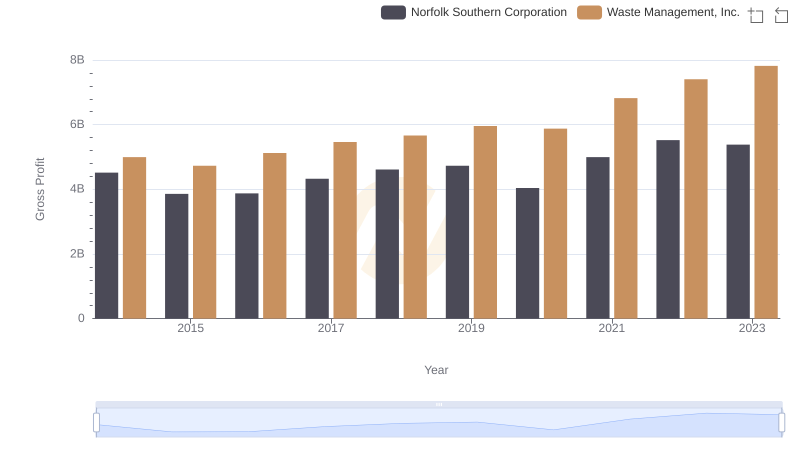
Gross Profit Analysis: Comparing Waste Management, Inc. and Norfolk Southern Corporation
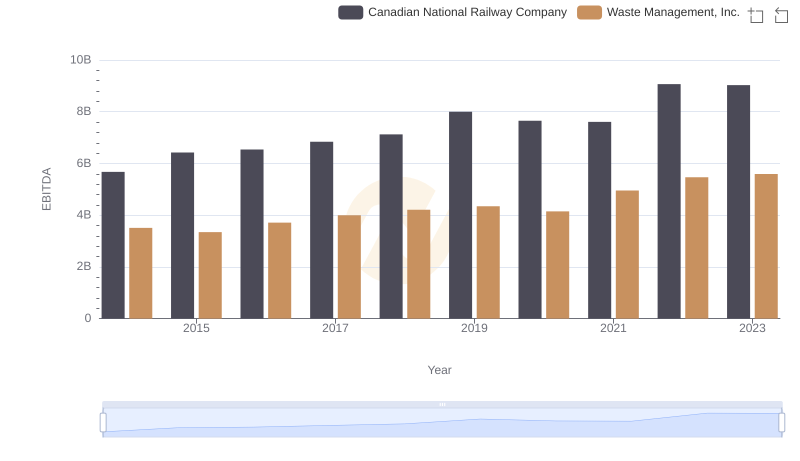
Comparative EBITDA Analysis: Waste Management, Inc. vs Canadian National Railway Company
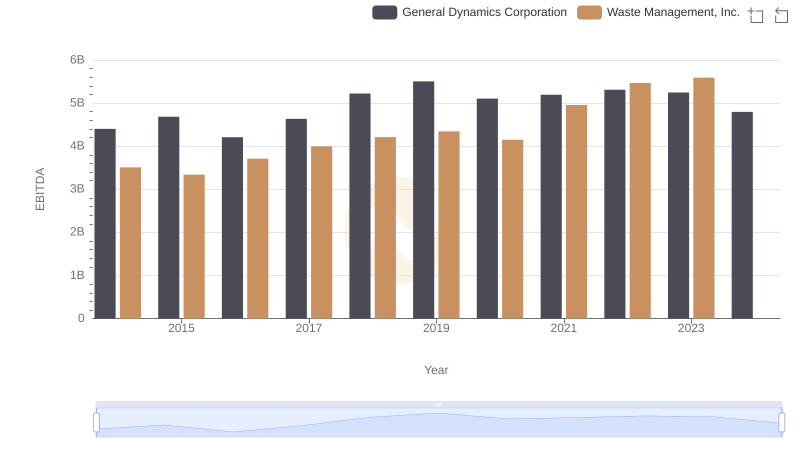
Comprehensive EBITDA Comparison: Waste Management, Inc. vs General Dynamics Corporation
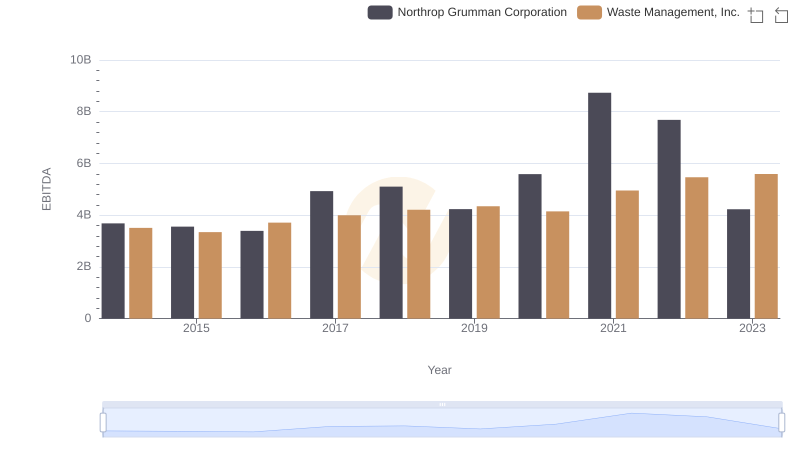
Waste Management, Inc. and Northrop Grumman Corporation: A Detailed Examination of EBITDA Performance
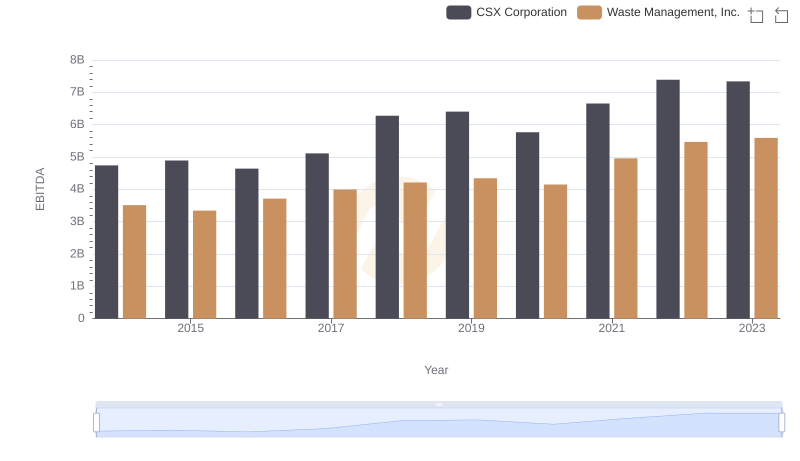
A Professional Review of EBITDA: Waste Management, Inc. Compared to CSX Corporation
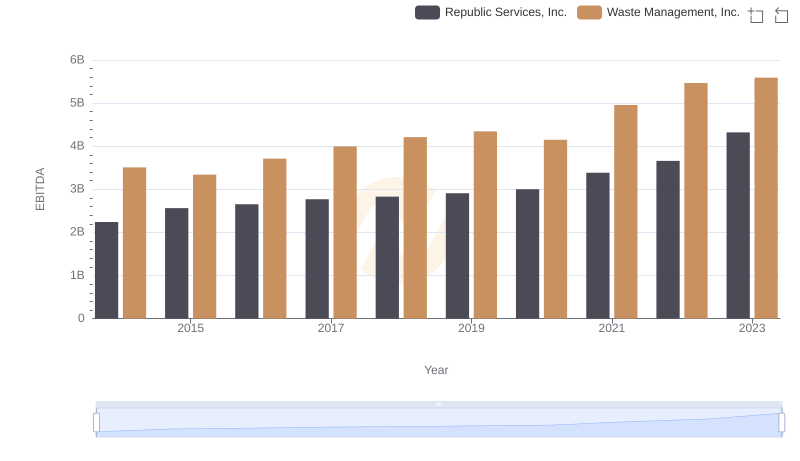
EBITDA Metrics Evaluated: Waste Management, Inc. vs Republic Services, Inc.
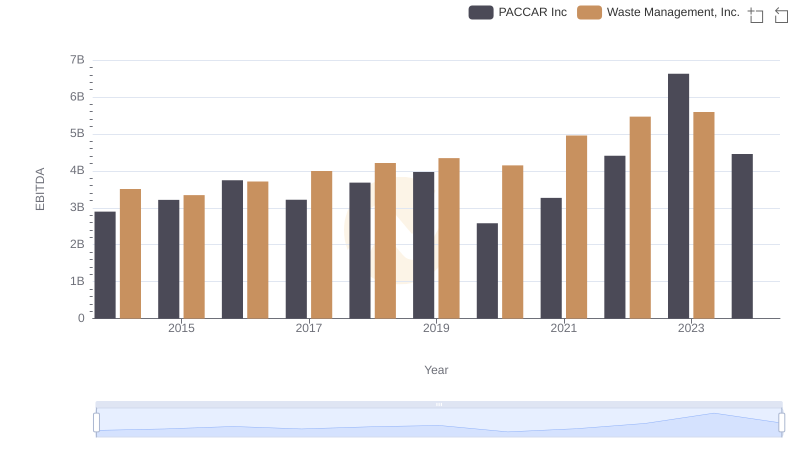
Comprehensive EBITDA Comparison: Waste Management, Inc. vs PACCAR Inc

Professional EBITDA Benchmarking: Waste Management, Inc. vs Roper Technologies, Inc.
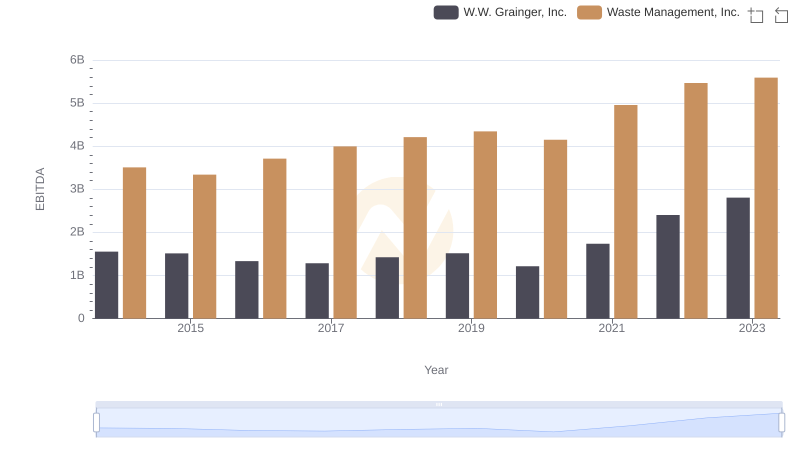
EBITDA Performance Review: Waste Management, Inc. vs W.W. Grainger, Inc.