| __timestamp | Roper Technologies, Inc. | Waste Management, Inc. |
|---|---|---|
| Wednesday, January 1, 2014 | 1199557000 | 3509000000 |
| Thursday, January 1, 2015 | 1238079000 | 3342000000 |
| Friday, January 1, 2016 | 1290510000 | 3713000000 |
| Sunday, January 1, 2017 | 1558802000 | 3996000000 |
| Monday, January 1, 2018 | 1746500000 | 4212000000 |
| Tuesday, January 1, 2019 | 2827900000 | 4344000000 |
| Wednesday, January 1, 2020 | 1782800000 | 4149000000 |
| Friday, January 1, 2021 | 1951500000 | 4956000000 |
| Saturday, January 1, 2022 | 2124500000 | 5466000000 |
| Sunday, January 1, 2023 | 2663000000 | 5592000000 |
| Monday, January 1, 2024 | 1996800000 | 5128000000 |
Unleashing the power of data
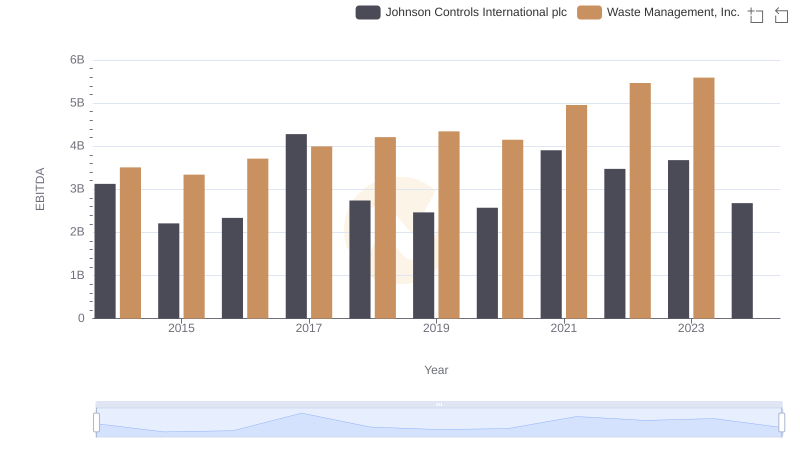
In the ever-evolving landscape of corporate finance, EBITDA serves as a crucial metric for evaluating a company's operational performance. Waste Management, Inc. and Roper Technologies, Inc. have been industry stalwarts, showcasing distinct financial trajectories over the past decade. From 2014 to 2023, Waste Management's EBITDA grew by approximately 59%, reflecting its robust market position and strategic expansions. In contrast, Roper Technologies experienced a remarkable 122% increase, underscoring its dynamic growth and adaptability in the tech sector.
Waste Management consistently outperformed Roper Technologies in absolute EBITDA terms, yet Roper's growth rate highlights its aggressive market strategies. By 2023, Waste Management's EBITDA reached its peak, while Roper Technologies demonstrated a steady upward trend, particularly post-2019. This comparison not only highlights sectoral differences but also offers insights into strategic financial management across industries.

Revenue Showdown: Waste Management, Inc. vs Roper Technologies, Inc.
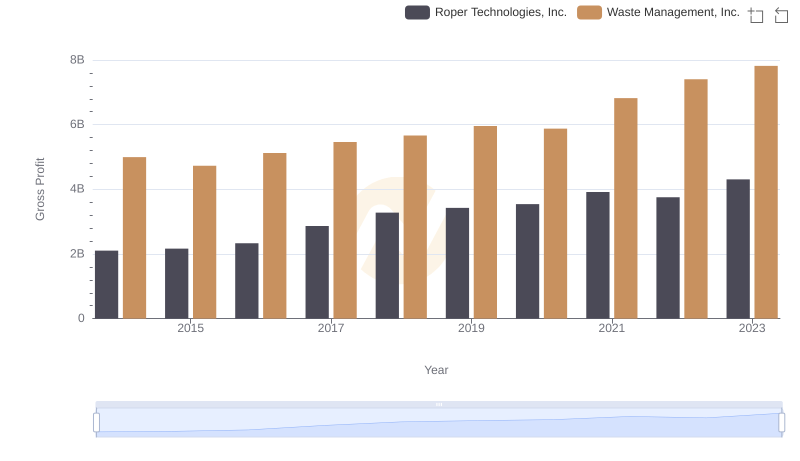
Who Generates Higher Gross Profit? Waste Management, Inc. or Roper Technologies, Inc.
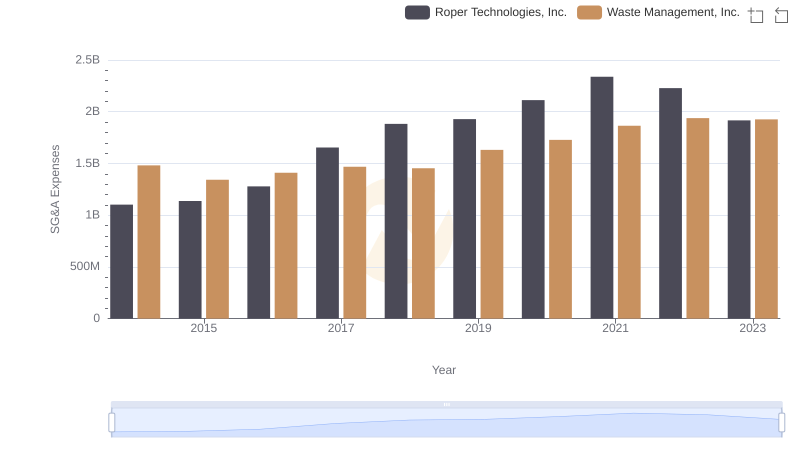
Who Optimizes SG&A Costs Better? Waste Management, Inc. or Roper Technologies, Inc.
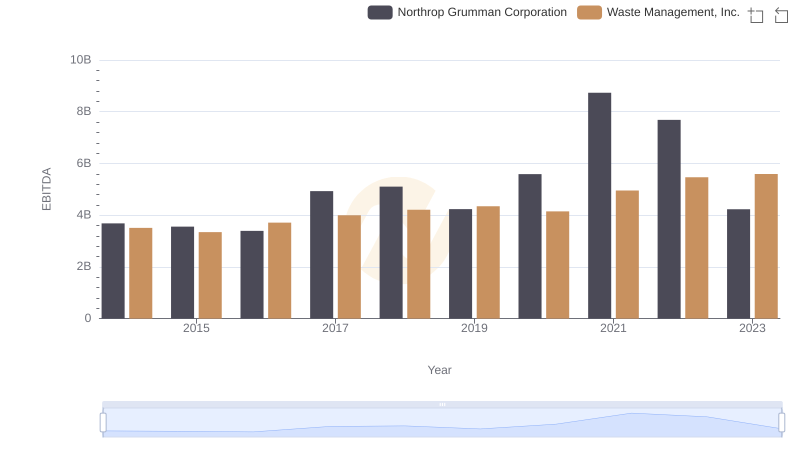
Waste Management, Inc. and Northrop Grumman Corporation: A Detailed Examination of EBITDA Performance
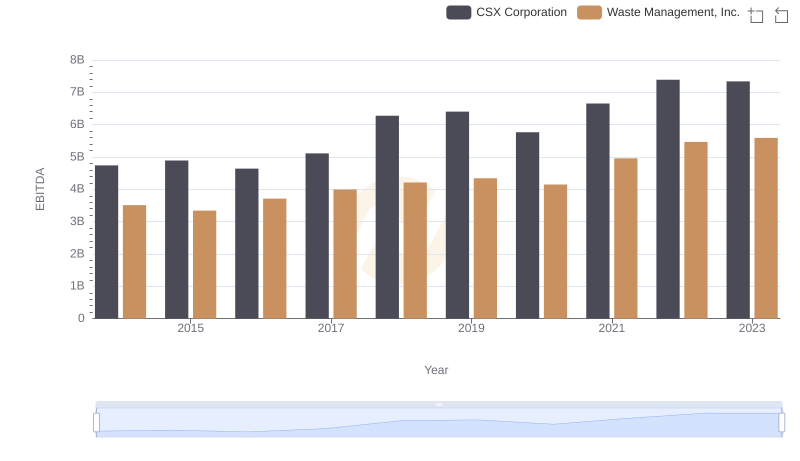
A Professional Review of EBITDA: Waste Management, Inc. Compared to CSX Corporation
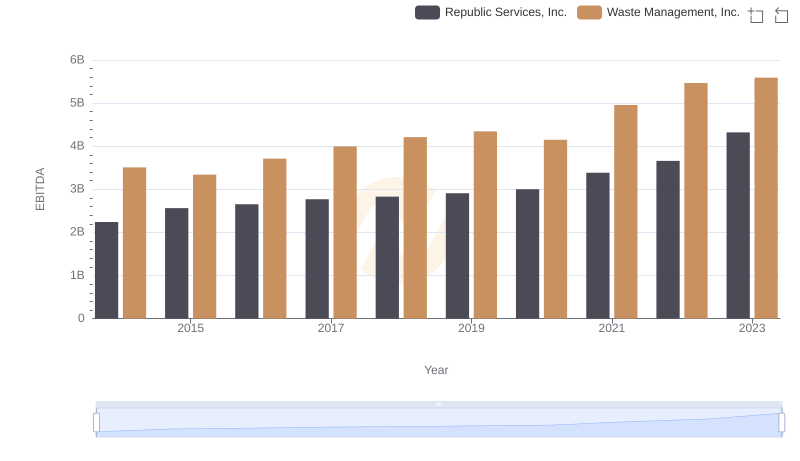
EBITDA Metrics Evaluated: Waste Management, Inc. vs Republic Services, Inc.
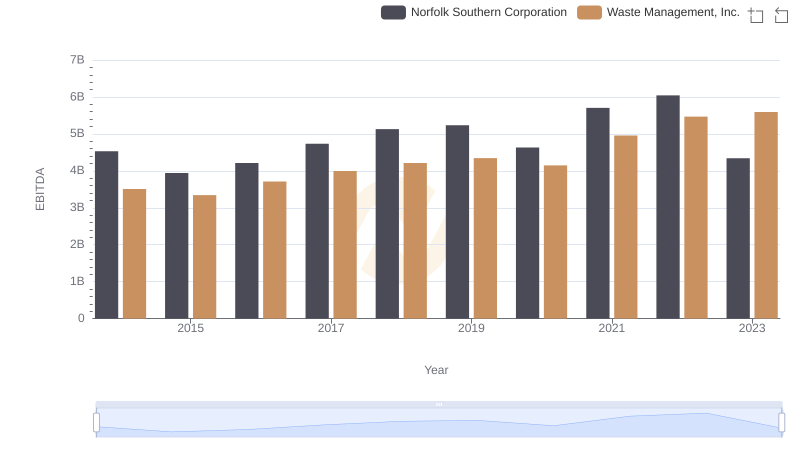
Waste Management, Inc. and Norfolk Southern Corporation: A Detailed Examination of EBITDA Performance
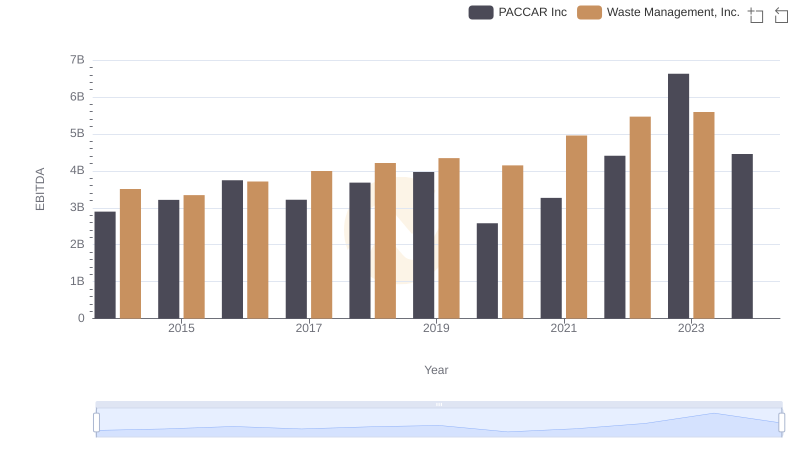
Comprehensive EBITDA Comparison: Waste Management, Inc. vs PACCAR Inc
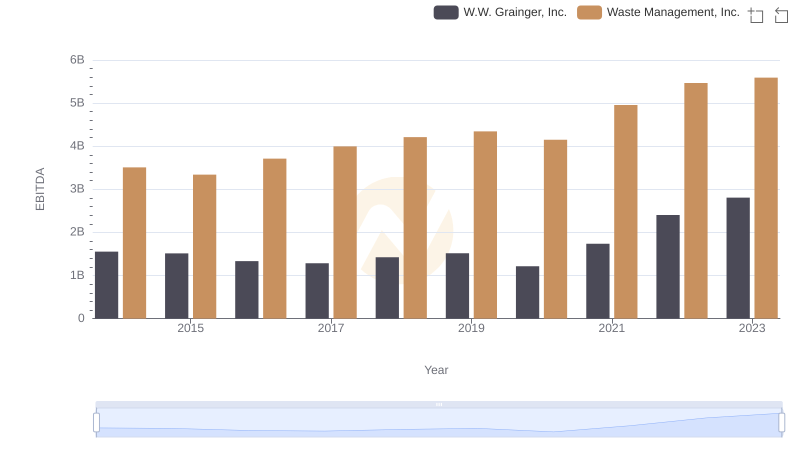
EBITDA Performance Review: Waste Management, Inc. vs W.W. Grainger, Inc.
EBITDA Metrics Evaluated: Waste Management, Inc. vs Johnson Controls International plc