| __timestamp | Johnson Controls International plc | Waste Management, Inc. |
|---|---|---|
| Wednesday, January 1, 2014 | 3125000000 | 3509000000 |
| Thursday, January 1, 2015 | 2209000000 | 3342000000 |
| Friday, January 1, 2016 | 2338000000 | 3713000000 |
| Sunday, January 1, 2017 | 4280000000 | 3996000000 |
| Monday, January 1, 2018 | 2741000000 | 4212000000 |
| Tuesday, January 1, 2019 | 2466000000 | 4344000000 |
| Wednesday, January 1, 2020 | 2572000000 | 4149000000 |
| Friday, January 1, 2021 | 3907000000 | 4956000000 |
| Saturday, January 1, 2022 | 3474000000 | 5466000000 |
| Sunday, January 1, 2023 | 3678000000 | 5592000000 |
| Monday, January 1, 2024 | 2800000000 | 5128000000 |
Infusing magic into the data realm
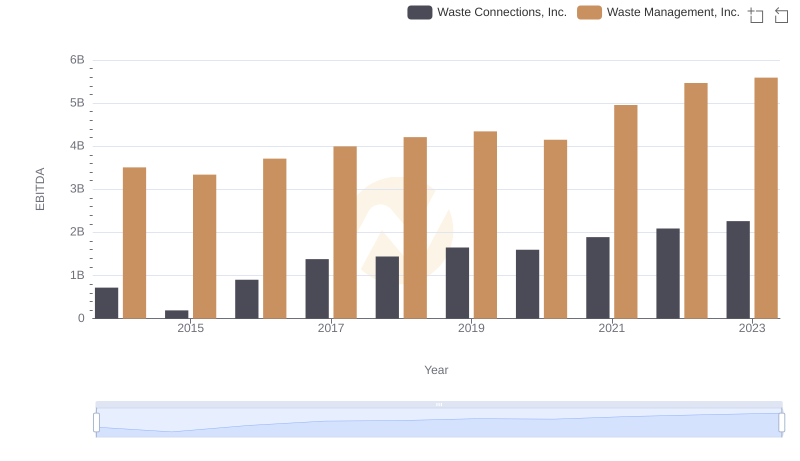
In the ever-evolving landscape of corporate finance, EBITDA serves as a crucial metric for evaluating a company's operational performance. This analysis juxtaposes the EBITDA trends of Waste Management, Inc. and Johnson Controls International plc from 2014 to 2023. Waste Management, Inc. has consistently outperformed its counterpart, with an average EBITDA approximately 42% higher over the decade. Notably, 2023 marked a peak for Waste Management, Inc., reaching an EBITDA of $5.6 billion, while Johnson Controls International plc saw a decline to $3.7 billion. The data reveals a steady upward trajectory for Waste Management, Inc., reflecting its robust operational efficiency and market adaptability. Conversely, Johnson Controls International plc experienced fluctuations, highlighting potential challenges in maintaining consistent growth. This comparative insight underscores the importance of strategic management in navigating the complexities of the global market.

Comparing Revenue Performance: Waste Management, Inc. or Johnson Controls International plc?
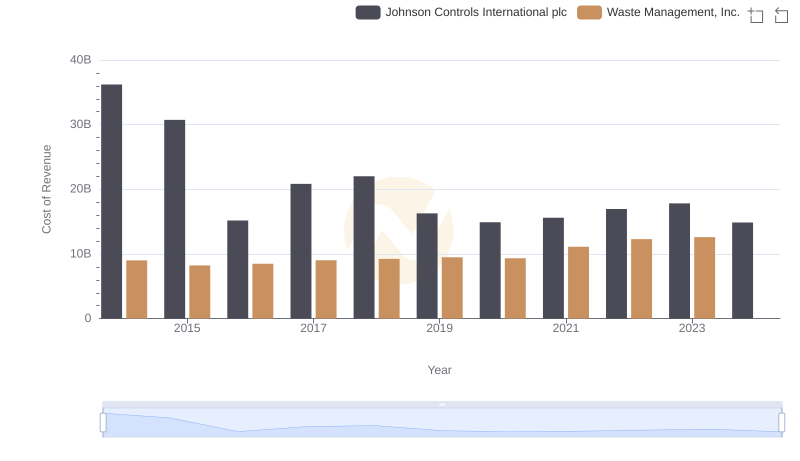
Cost Insights: Breaking Down Waste Management, Inc. and Johnson Controls International plc's Expenses
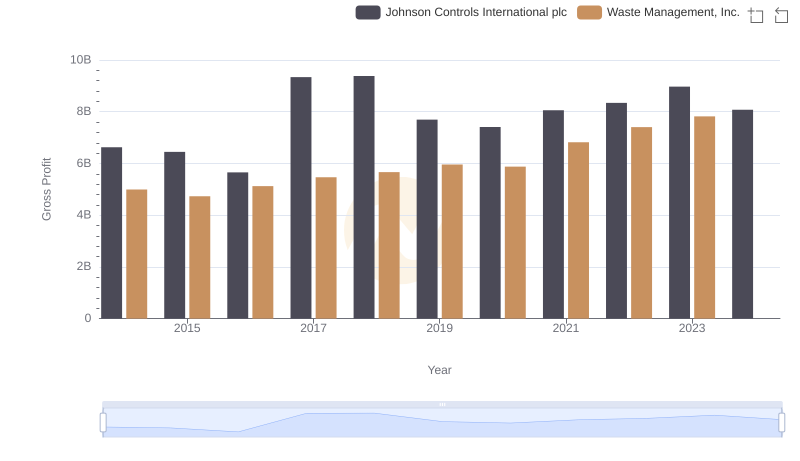
Waste Management, Inc. and Johnson Controls International plc: A Detailed Gross Profit Analysis
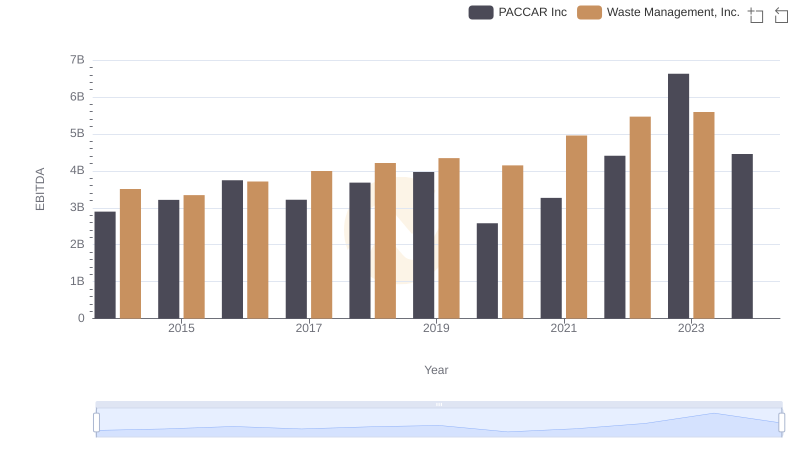
Comprehensive EBITDA Comparison: Waste Management, Inc. vs PACCAR Inc

Professional EBITDA Benchmarking: Waste Management, Inc. vs Roper Technologies, Inc.
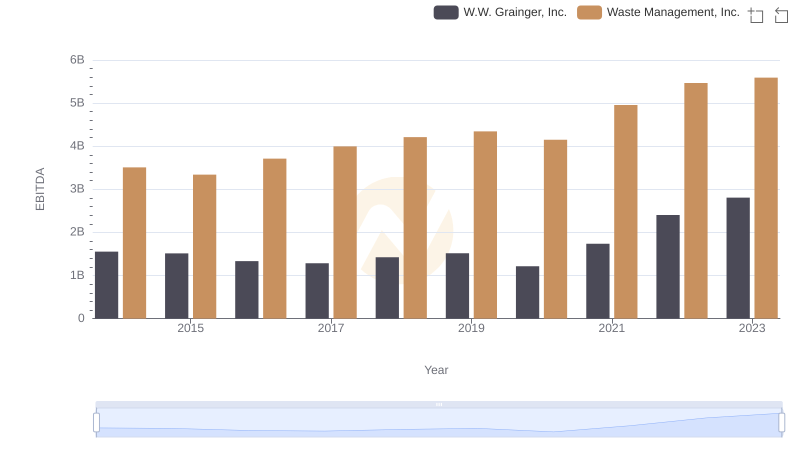
EBITDA Performance Review: Waste Management, Inc. vs W.W. Grainger, Inc.
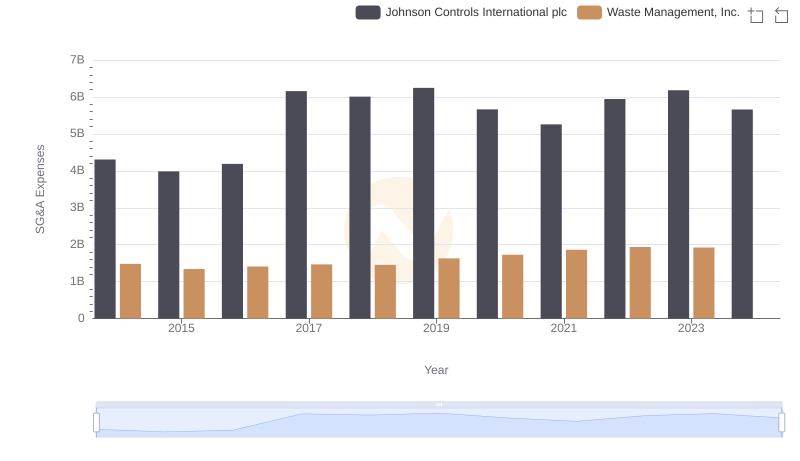
Waste Management, Inc. and Johnson Controls International plc: SG&A Spending Patterns Compared
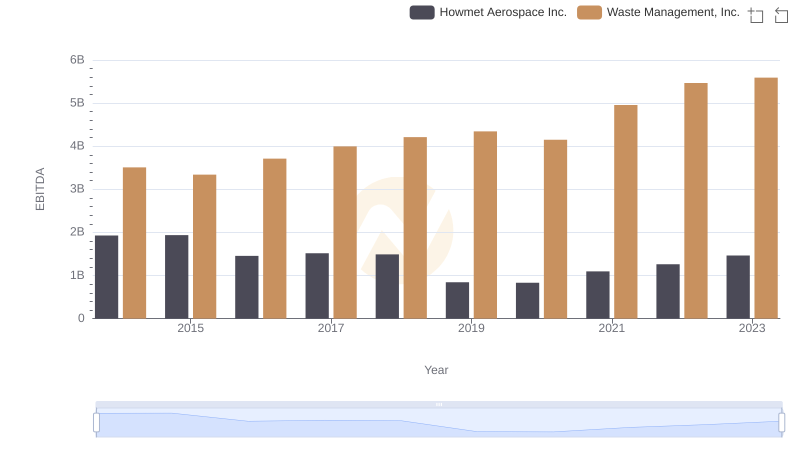
A Side-by-Side Analysis of EBITDA: Waste Management, Inc. and Howmet Aerospace Inc.
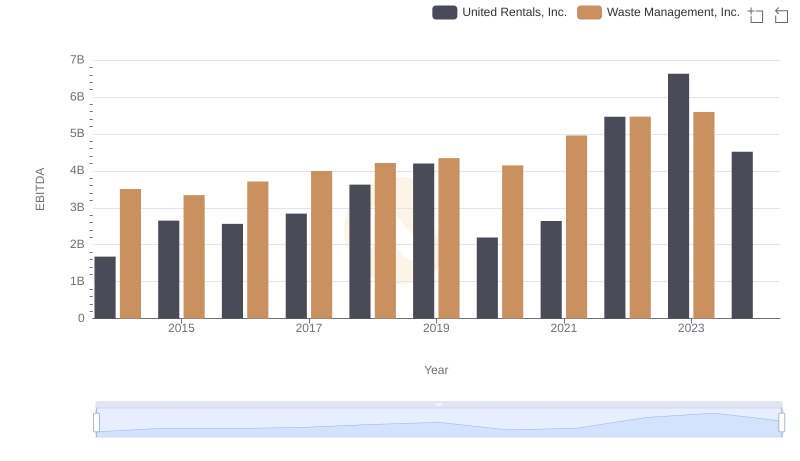
Comprehensive EBITDA Comparison: Waste Management, Inc. vs United Rentals, Inc.
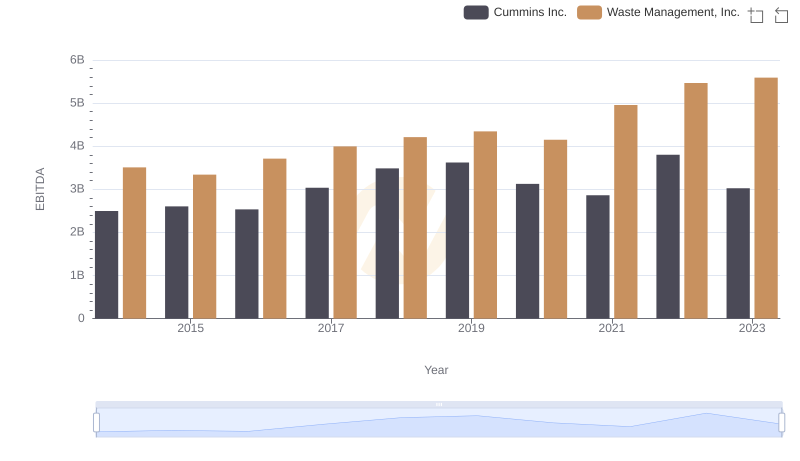
EBITDA Metrics Evaluated: Waste Management, Inc. vs Cummins Inc.
A Side-by-Side Analysis of EBITDA: Waste Management, Inc. and Waste Connections, Inc.