| __timestamp | PACCAR Inc | Waste Management, Inc. |
|---|---|---|
| Wednesday, January 1, 2014 | 2896200000 | 3509000000 |
| Thursday, January 1, 2015 | 3212900000 | 3342000000 |
| Friday, January 1, 2016 | 3745900000 | 3713000000 |
| Sunday, January 1, 2017 | 3215800000 | 3996000000 |
| Monday, January 1, 2018 | 3681700000 | 4212000000 |
| Tuesday, January 1, 2019 | 3969900000 | 4344000000 |
| Wednesday, January 1, 2020 | 2581000000 | 4149000000 |
| Friday, January 1, 2021 | 3268200000 | 4956000000 |
| Saturday, January 1, 2022 | 4407800000 | 5466000000 |
| Sunday, January 1, 2023 | 6626900000 | 5592000000 |
| Monday, January 1, 2024 | 4456800000 | 5128000000 |
Cracking the code
In the ever-evolving landscape of American industry, Waste Management, Inc. and PACCAR Inc have emerged as titans in their respective fields. Over the past decade, these companies have showcased their financial prowess through EBITDA, a key indicator of operational performance. From 2014 to 2023, Waste Management consistently outperformed PACCAR, with an average EBITDA approximately 13% higher. However, 2023 marked a turning point as PACCAR surged ahead, achieving a 50% increase from the previous year, while Waste Management's growth plateaued.
As we look to the future, the data suggests a potential shift in market dynamics. With PACCAR's recent momentum, the competition is heating up. Investors and industry watchers alike will be keen to see if Waste Management can reclaim its lead or if PACCAR will continue its upward trajectory.
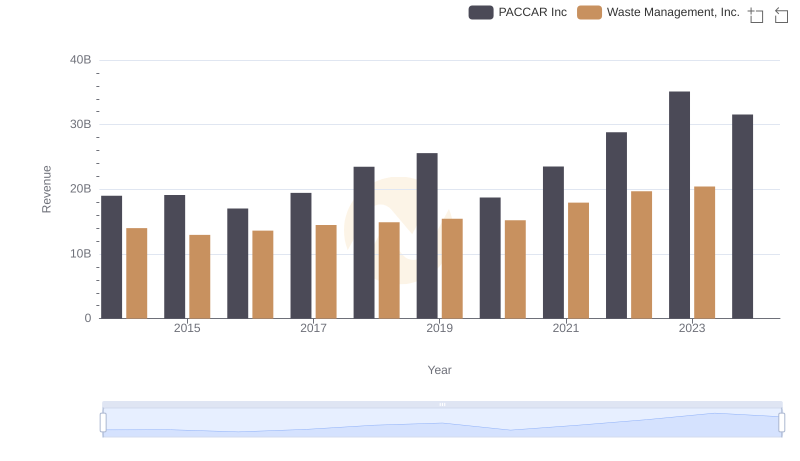
Waste Management, Inc. vs PACCAR Inc: Examining Key Revenue Metrics
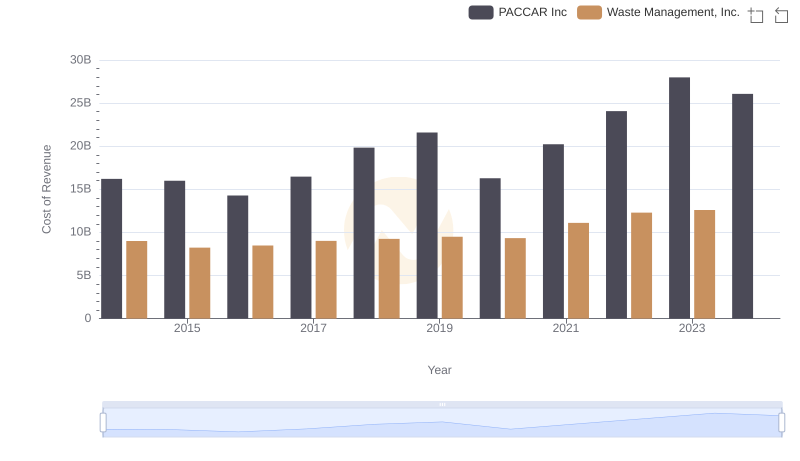
Waste Management, Inc. vs PACCAR Inc: Efficiency in Cost of Revenue Explored
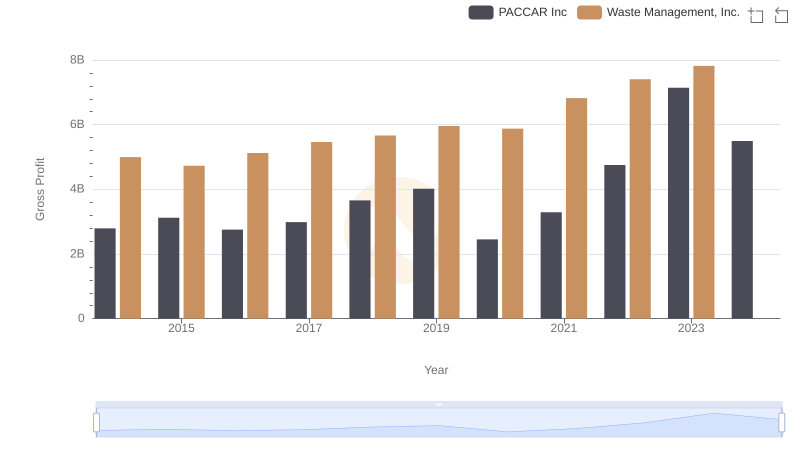
Key Insights on Gross Profit: Waste Management, Inc. vs PACCAR Inc
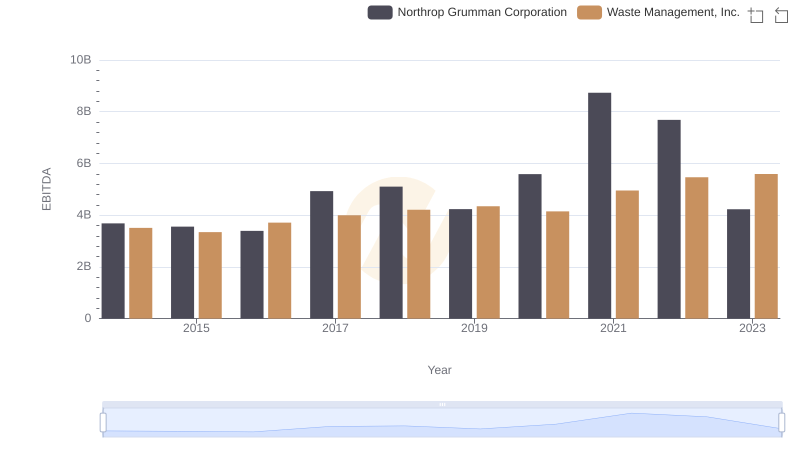
Waste Management, Inc. and Northrop Grumman Corporation: A Detailed Examination of EBITDA Performance
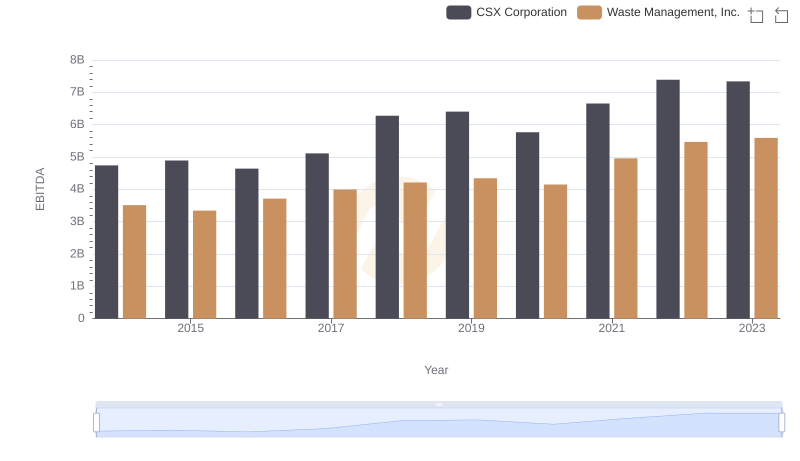
A Professional Review of EBITDA: Waste Management, Inc. Compared to CSX Corporation
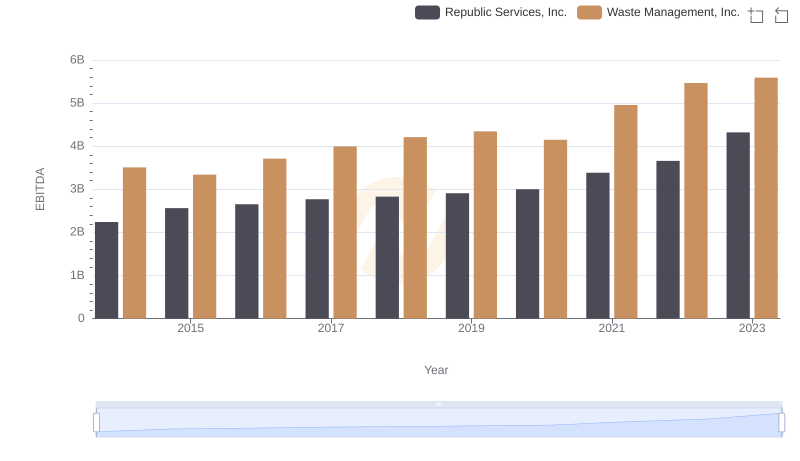
EBITDA Metrics Evaluated: Waste Management, Inc. vs Republic Services, Inc.
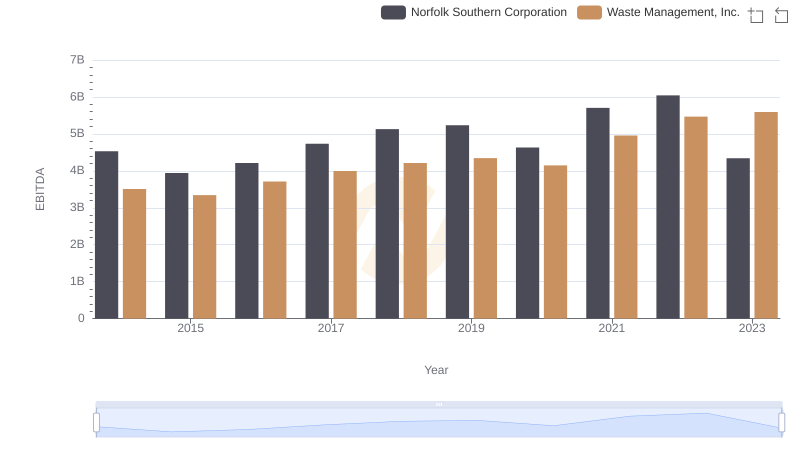
Waste Management, Inc. and Norfolk Southern Corporation: A Detailed Examination of EBITDA Performance
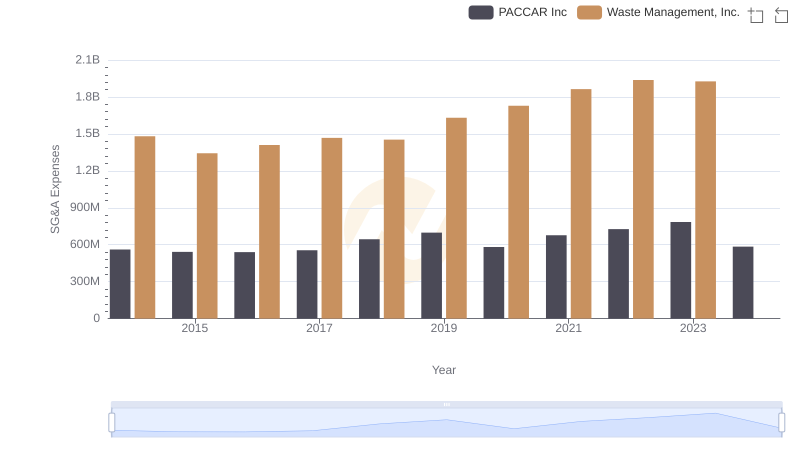
Waste Management, Inc. and PACCAR Inc: SG&A Spending Patterns Compared

Professional EBITDA Benchmarking: Waste Management, Inc. vs Roper Technologies, Inc.
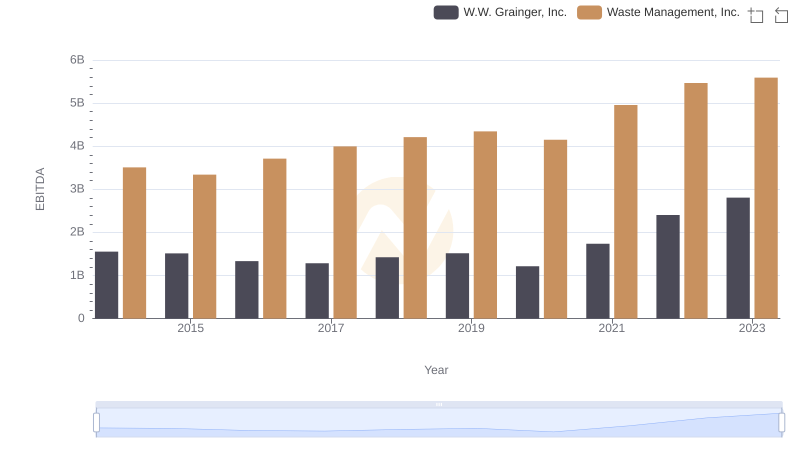
EBITDA Performance Review: Waste Management, Inc. vs W.W. Grainger, Inc.
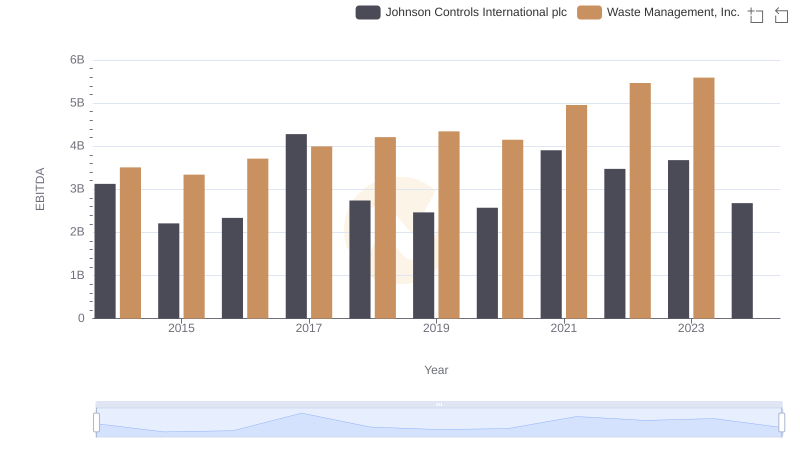
EBITDA Metrics Evaluated: Waste Management, Inc. vs Johnson Controls International plc