| __timestamp | CSX Corporation | Waste Management, Inc. |
|---|---|---|
| Wednesday, January 1, 2014 | 4740000000 | 3509000000 |
| Thursday, January 1, 2015 | 4890000000 | 3342000000 |
| Friday, January 1, 2016 | 4640000000 | 3713000000 |
| Sunday, January 1, 2017 | 5113000000 | 3996000000 |
| Monday, January 1, 2018 | 6274000000 | 4212000000 |
| Tuesday, January 1, 2019 | 6402000000 | 4344000000 |
| Wednesday, January 1, 2020 | 5764000000 | 4149000000 |
| Friday, January 1, 2021 | 6653000000 | 4956000000 |
| Saturday, January 1, 2022 | 7390000000 | 5466000000 |
| Sunday, January 1, 2023 | 7340000000 | 5592000000 |
| Monday, January 1, 2024 | 5128000000 |
In pursuit of knowledge
In the ever-evolving landscape of American industry, Waste Management, Inc. and CSX Corporation have emerged as titans in their respective fields. Over the past decade, from 2014 to 2023, these companies have demonstrated remarkable financial resilience, as evidenced by their EBITDA performance.
CSX Corporation, a leader in rail transportation, has seen its EBITDA grow by approximately 55%, peaking in 2022. Meanwhile, Waste Management, Inc., a stalwart in waste services, has achieved a 59% increase in EBITDA, reaching its zenith in 2023. This growth underscores the robust demand for essential services, even amidst economic fluctuations.
The data reveals a compelling narrative of strategic adaptation and market leadership. As we look to the future, these companies are well-positioned to continue their upward trajectory, driven by innovation and operational excellence.
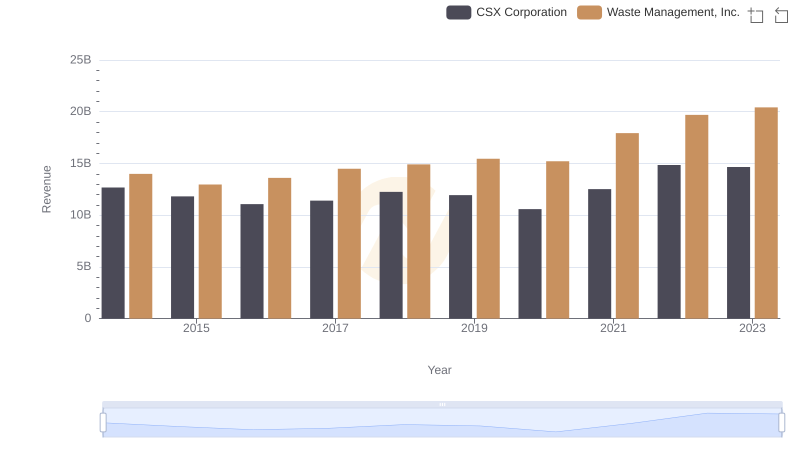
Waste Management, Inc. vs CSX Corporation: Annual Revenue Growth Compared
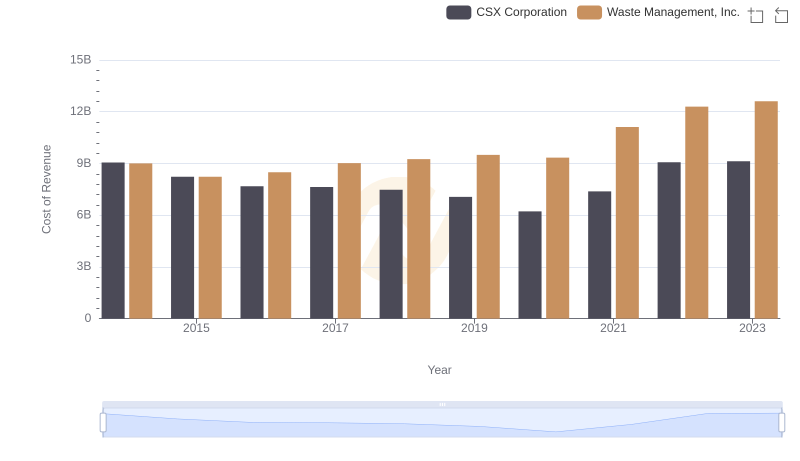
Cost of Revenue Comparison: Waste Management, Inc. vs CSX Corporation
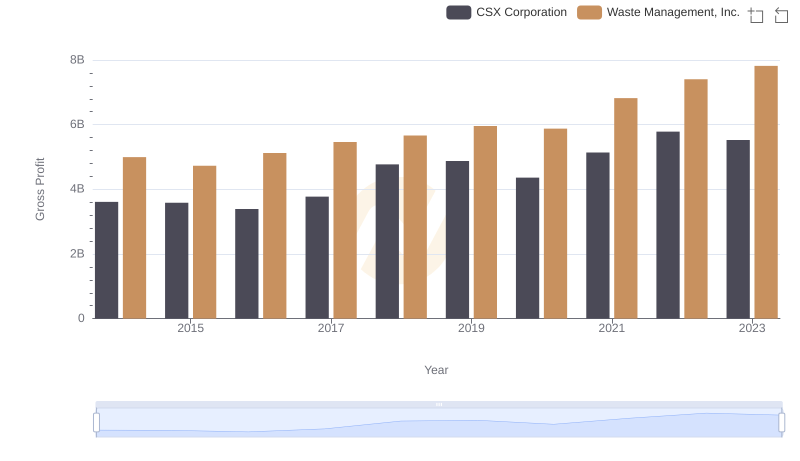
Waste Management, Inc. vs CSX Corporation: A Gross Profit Performance Breakdown
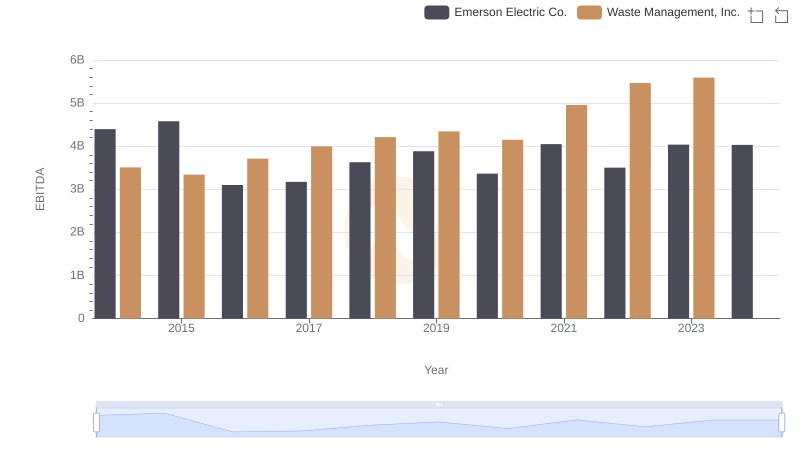
A Side-by-Side Analysis of EBITDA: Waste Management, Inc. and Emerson Electric Co.
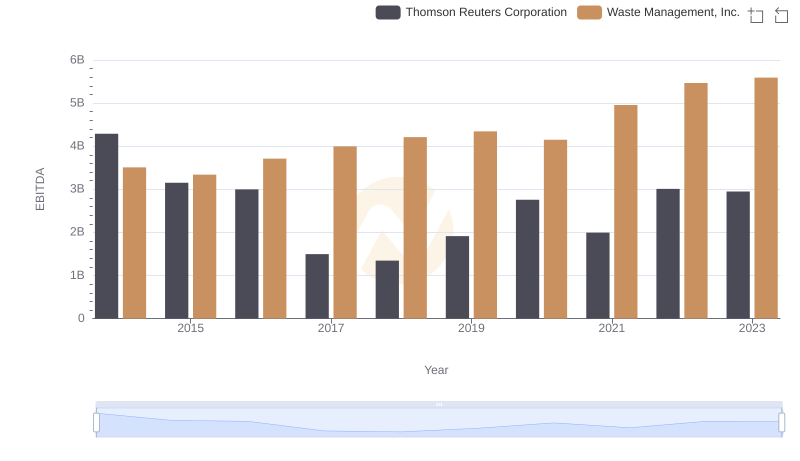
EBITDA Performance Review: Waste Management, Inc. vs Thomson Reuters Corporation

Professional EBITDA Benchmarking: Waste Management, Inc. vs FedEx Corporation
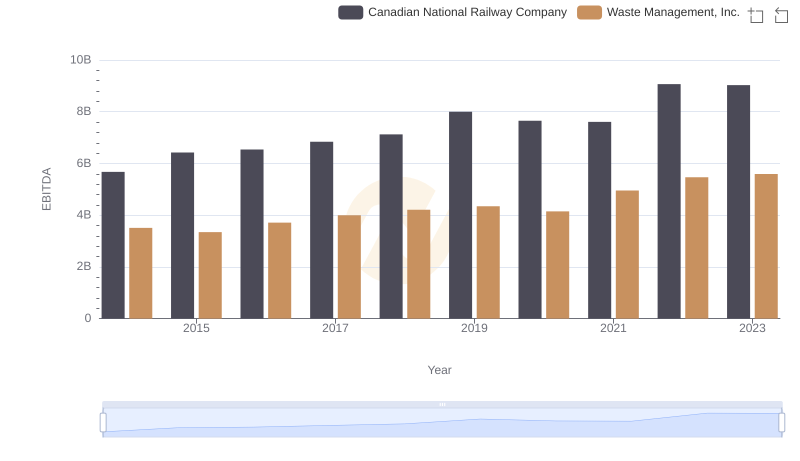
Comparative EBITDA Analysis: Waste Management, Inc. vs Canadian National Railway Company
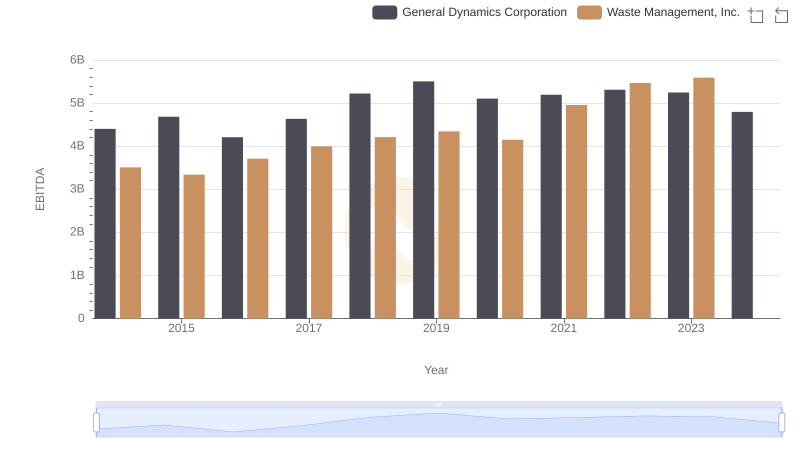
Comprehensive EBITDA Comparison: Waste Management, Inc. vs General Dynamics Corporation
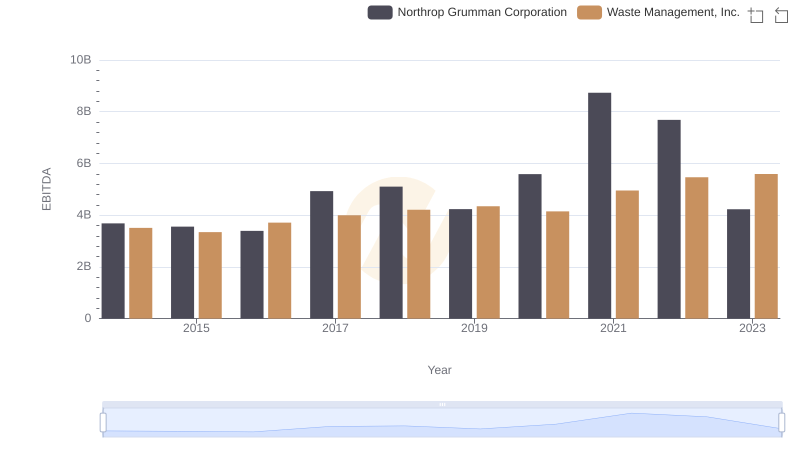
Waste Management, Inc. and Northrop Grumman Corporation: A Detailed Examination of EBITDA Performance
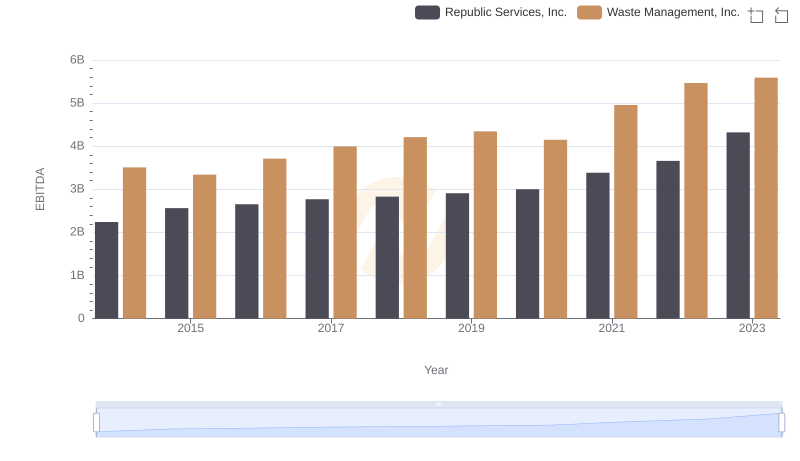
EBITDA Metrics Evaluated: Waste Management, Inc. vs Republic Services, Inc.
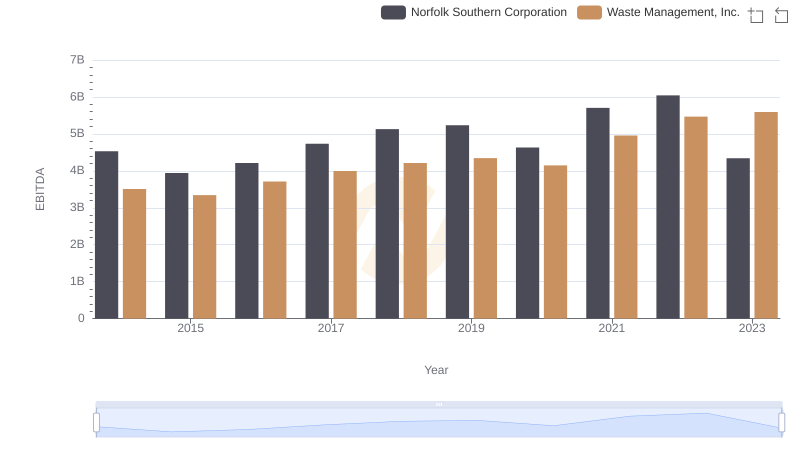
Waste Management, Inc. and Norfolk Southern Corporation: A Detailed Examination of EBITDA Performance
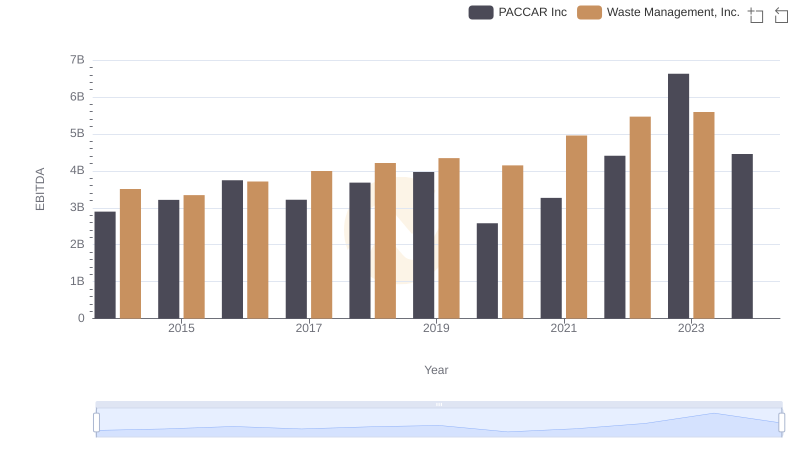
Comprehensive EBITDA Comparison: Waste Management, Inc. vs PACCAR Inc