| __timestamp | W.W. Grainger, Inc. | Waste Management, Inc. |
|---|---|---|
| Wednesday, January 1, 2014 | 5650711000 | 9002000000 |
| Thursday, January 1, 2015 | 5741956000 | 8231000000 |
| Friday, January 1, 2016 | 6022647000 | 8486000000 |
| Sunday, January 1, 2017 | 6327301000 | 9021000000 |
| Monday, January 1, 2018 | 6873000000 | 9249000000 |
| Tuesday, January 1, 2019 | 7089000000 | 9496000000 |
| Wednesday, January 1, 2020 | 7559000000 | 9341000000 |
| Friday, January 1, 2021 | 8302000000 | 11111000000 |
| Saturday, January 1, 2022 | 9379000000 | 12294000000 |
| Sunday, January 1, 2023 | 9982000000 | 12606000000 |
| Monday, January 1, 2024 | 10410000000 | 13383000000 |
Unleashing insights
In the ever-evolving landscape of corporate efficiency, Waste Management, Inc. and W.W. Grainger, Inc. stand as intriguing case studies. Over the past decade, from 2014 to 2023, these industry giants have showcased distinct trends in their cost of revenue. Waste Management, Inc. consistently outpaced W.W. Grainger, Inc., with an average cost of revenue approximately 35% higher. Notably, Waste Management's cost of revenue surged by nearly 40% from 2014 to 2023, peaking at $12.6 billion in 2023. Meanwhile, W.W. Grainger, Inc. experienced a 77% increase, reaching $9.98 billion in the same year. This data highlights the dynamic nature of cost management strategies in different sectors. As companies strive for efficiency, understanding these trends offers valuable insights into the financial health and operational strategies of leading corporations.
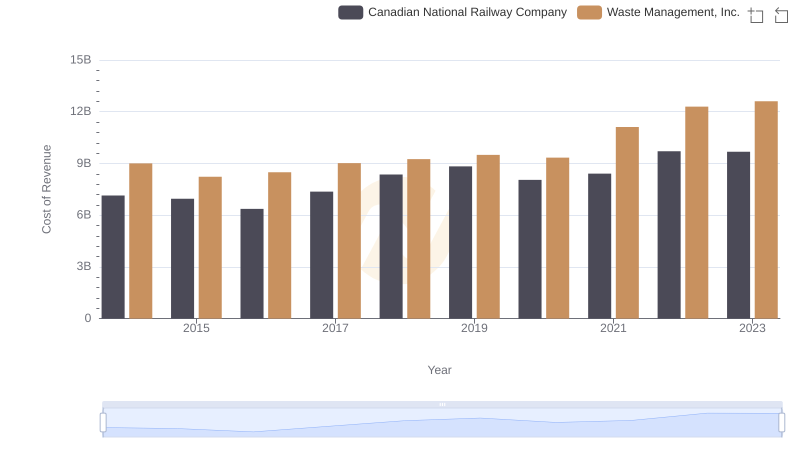
Waste Management, Inc. vs Canadian National Railway Company: Efficiency in Cost of Revenue Explored
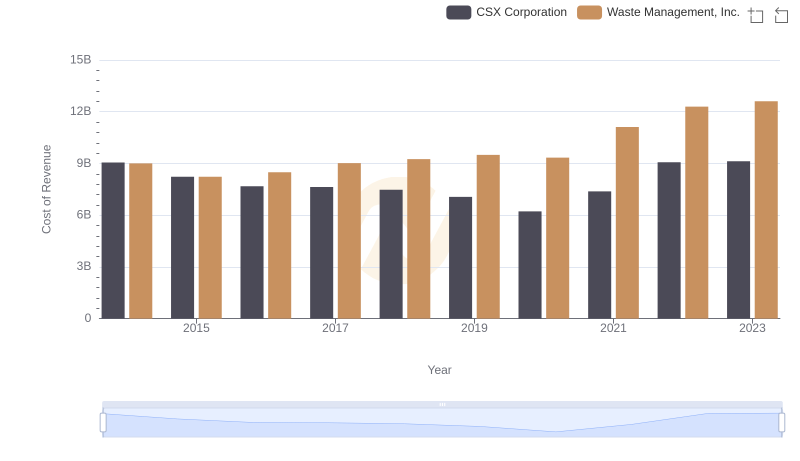
Cost of Revenue Comparison: Waste Management, Inc. vs CSX Corporation
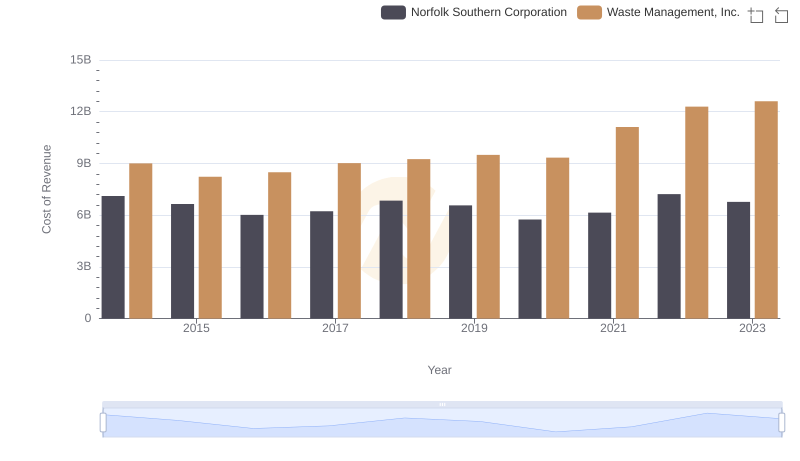
Analyzing Cost of Revenue: Waste Management, Inc. and Norfolk Southern Corporation
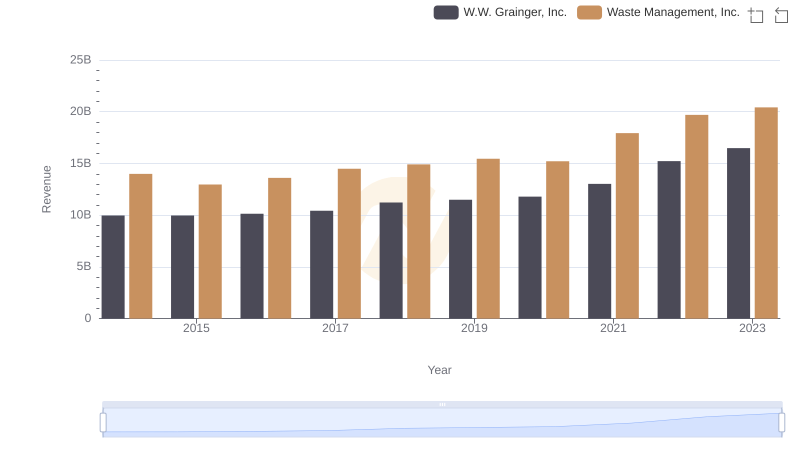
Breaking Down Revenue Trends: Waste Management, Inc. vs W.W. Grainger, Inc.
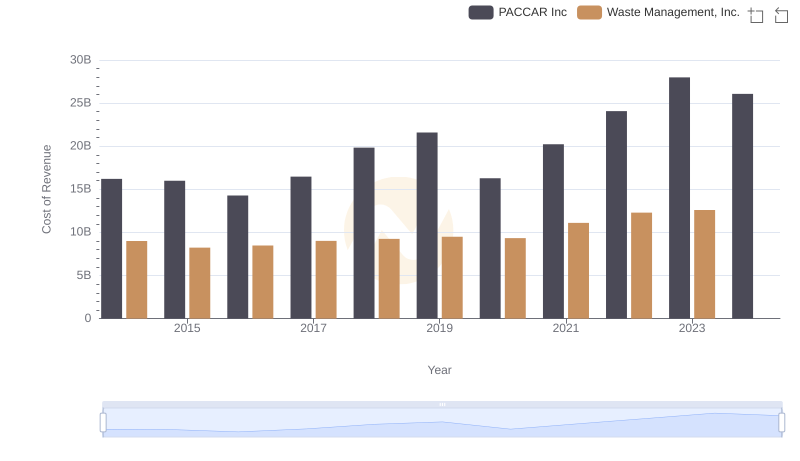
Waste Management, Inc. vs PACCAR Inc: Efficiency in Cost of Revenue Explored
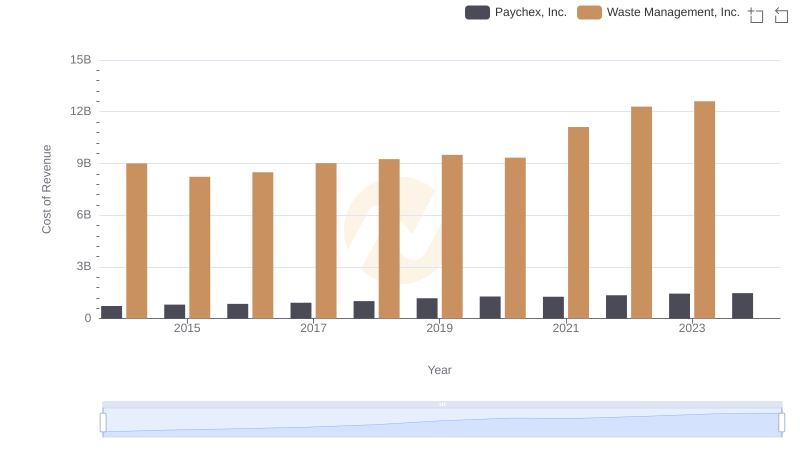
Cost of Revenue Comparison: Waste Management, Inc. vs Paychex, Inc.
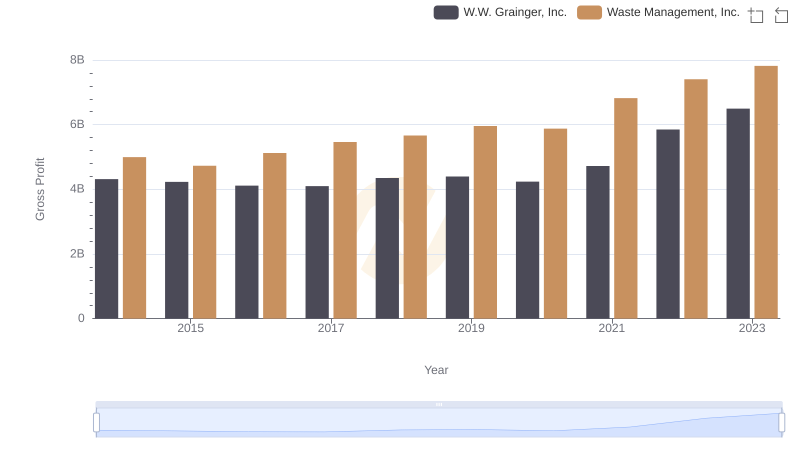
Gross Profit Trends Compared: Waste Management, Inc. vs W.W. Grainger, Inc.
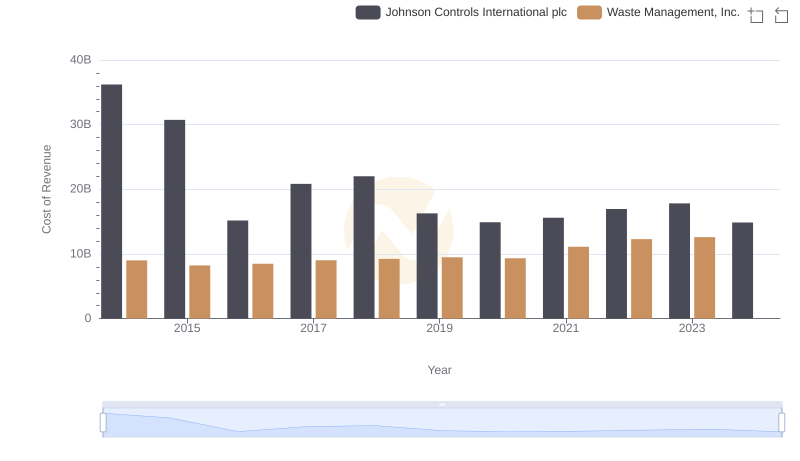
Cost Insights: Breaking Down Waste Management, Inc. and Johnson Controls International plc's Expenses
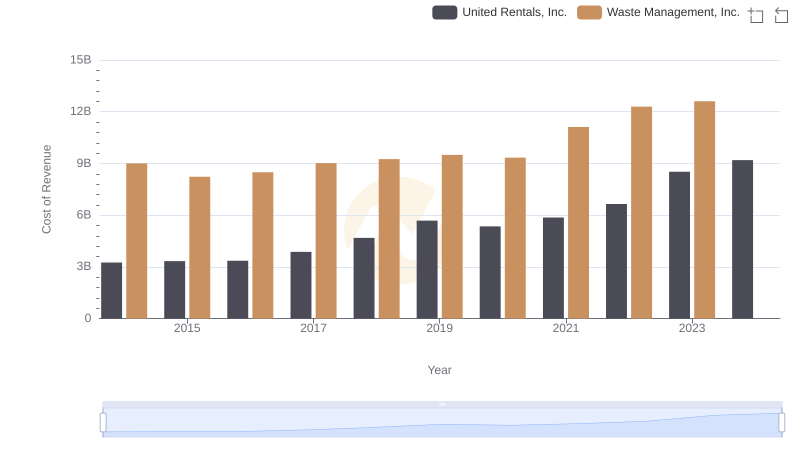
Analyzing Cost of Revenue: Waste Management, Inc. and United Rentals, Inc.
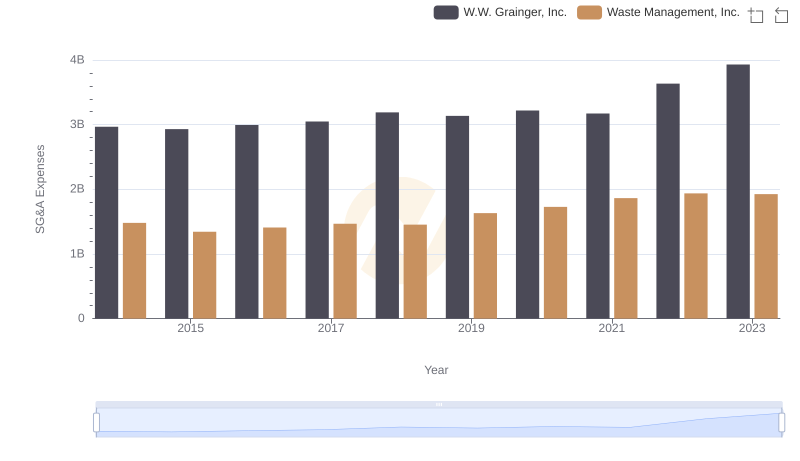
Waste Management, Inc. and W.W. Grainger, Inc.: SG&A Spending Patterns Compared
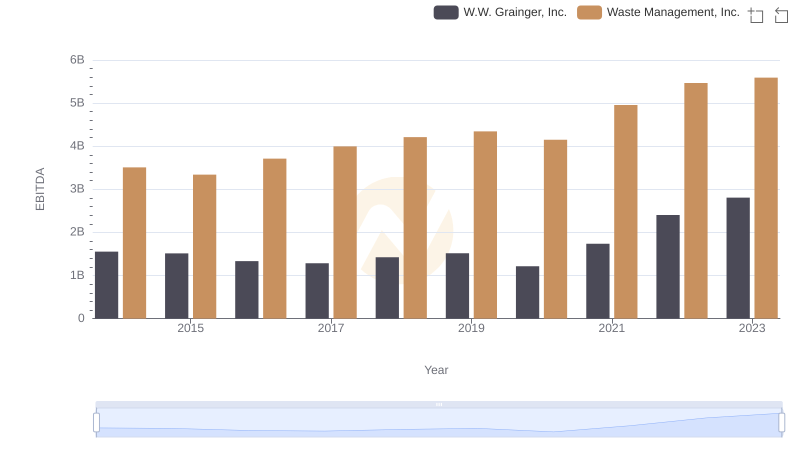
EBITDA Performance Review: Waste Management, Inc. vs W.W. Grainger, Inc.