| __timestamp | Dover Corporation | Rockwell Automation, Inc. |
|---|---|---|
| Wednesday, January 1, 2014 | 2974249000 | 2753900000 |
| Thursday, January 1, 2015 | 2568144000 | 2703100000 |
| Friday, January 1, 2016 | 2471969000 | 2475500000 |
| Sunday, January 1, 2017 | 2890377000 | 2624200000 |
| Monday, January 1, 2018 | 2559556000 | 2872200000 |
| Tuesday, January 1, 2019 | 2620938000 | 2900100000 |
| Wednesday, January 1, 2020 | 2474019000 | 2595200000 |
| Friday, January 1, 2021 | 2969786000 | 2897700000 |
| Saturday, January 1, 2022 | 3063556000 | 3102000000 |
| Sunday, January 1, 2023 | 3084633000 | 3717000000 |
| Monday, January 1, 2024 | 2958621000 | 3193400000 |
Unveiling the hidden dimensions of data
In the competitive landscape of industrial automation and manufacturing, Rockwell Automation, Inc. and Dover Corporation have been pivotal players. Over the past decade, from 2014 to 2023, these giants have showcased intriguing trends in their gross profits. Rockwell Automation has consistently outperformed Dover Corporation, with a notable peak in 2023, where its gross profit surged by approximately 35% compared to 2014. Dover, while showing resilience, experienced fluctuations, with a dip in 2016 but a recovery by 2023, marking a 4% increase from its 2014 figures.
The data reveals Rockwell's strategic advancements in automation technology, driving its profitability. Meanwhile, Dover's diverse industrial portfolio has provided stability, albeit with slower growth. The absence of data for 2024 suggests a potential shift or anomaly, inviting further analysis. This comparison underscores the dynamic nature of the industrial sector, where innovation and adaptability are key to financial success.
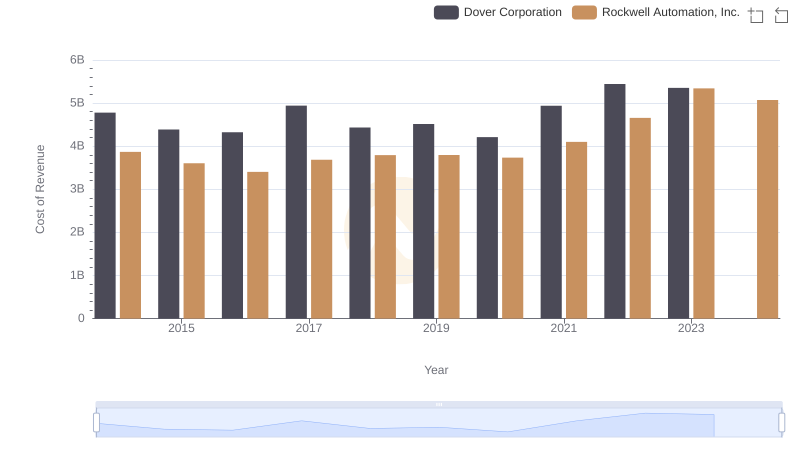
Analyzing Cost of Revenue: Rockwell Automation, Inc. and Dover Corporation
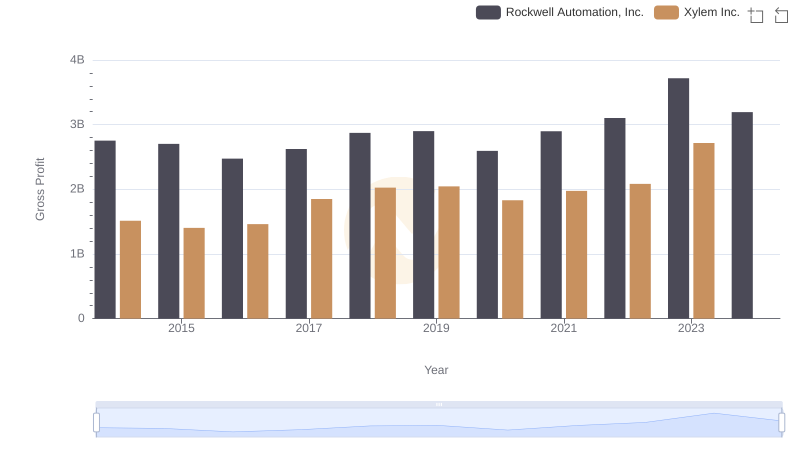
Gross Profit Comparison: Rockwell Automation, Inc. and Xylem Inc. Trends
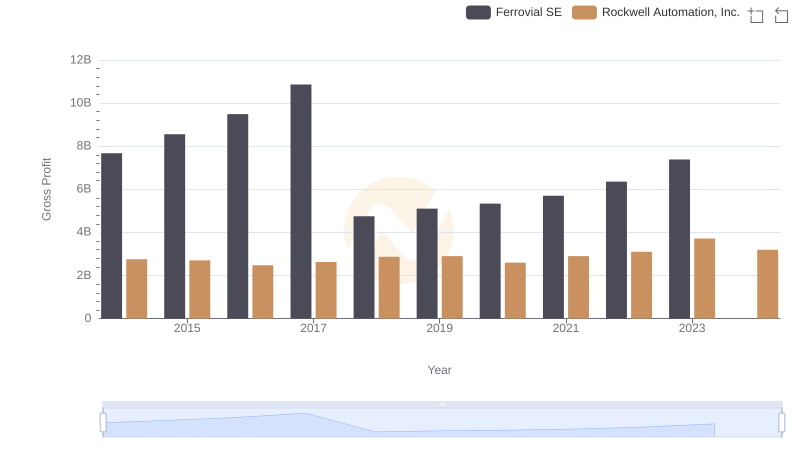
Key Insights on Gross Profit: Rockwell Automation, Inc. vs Ferrovial SE
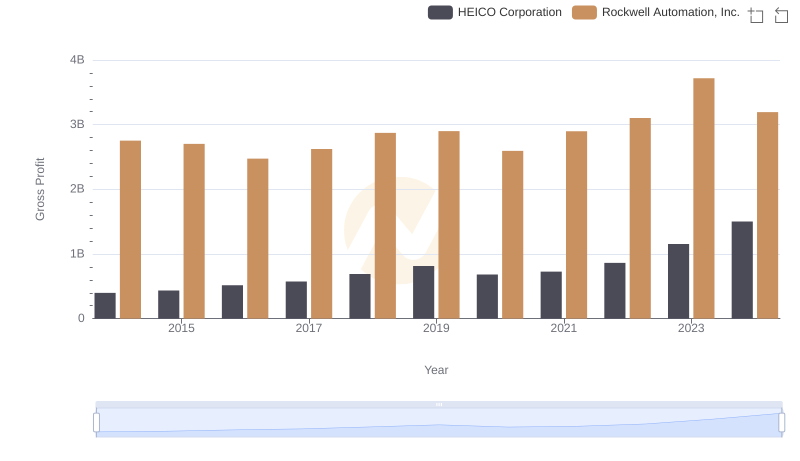
Gross Profit Analysis: Comparing Rockwell Automation, Inc. and HEICO Corporation
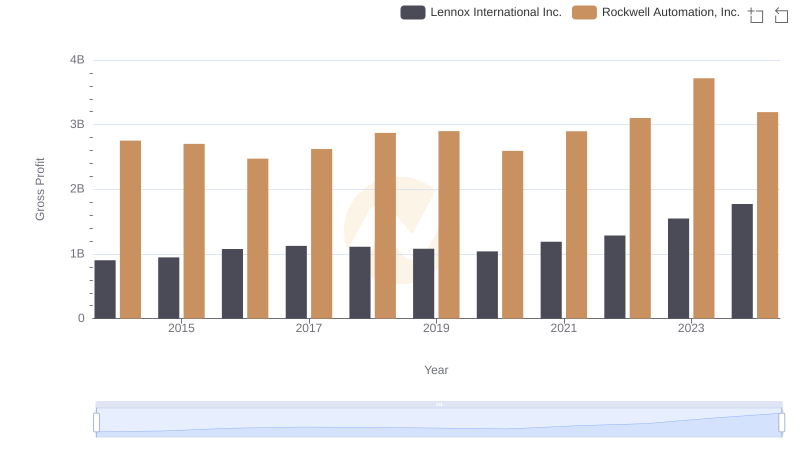
Rockwell Automation, Inc. vs Lennox International Inc.: A Gross Profit Performance Breakdown

Key Insights on Gross Profit: Rockwell Automation, Inc. vs Hubbell Incorporated
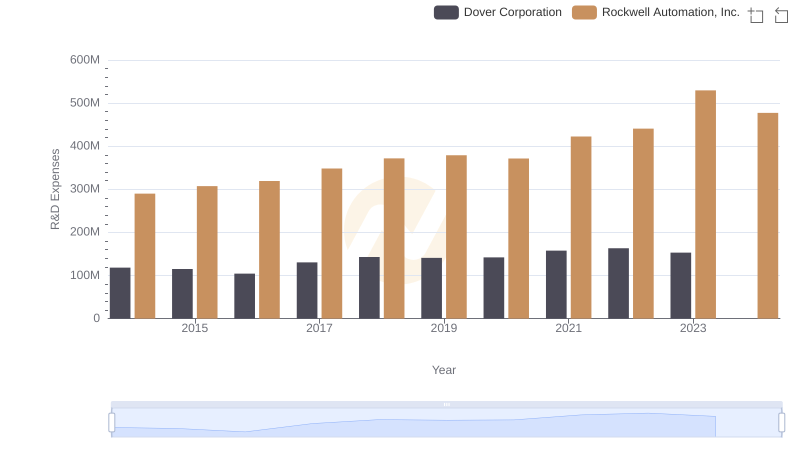
Analyzing R&D Budgets: Rockwell Automation, Inc. vs Dover Corporation
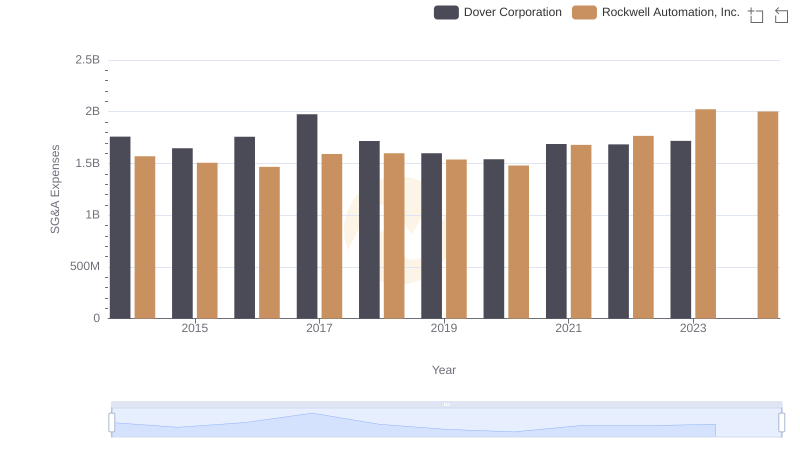
Cost Management Insights: SG&A Expenses for Rockwell Automation, Inc. and Dover Corporation
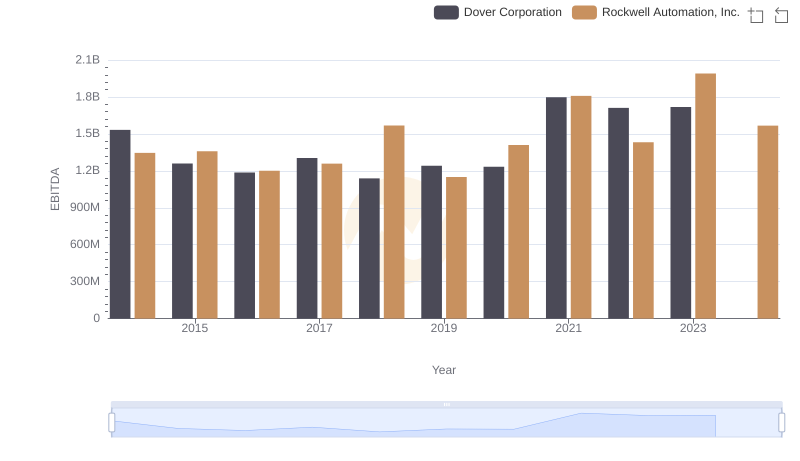
EBITDA Performance Review: Rockwell Automation, Inc. vs Dover Corporation