| __timestamp | Dover Corporation | Rockwell Automation, Inc. |
|---|---|---|
| Wednesday, January 1, 2014 | 4778479000 | 3869600000 |
| Thursday, January 1, 2015 | 4388167000 | 3604800000 |
| Friday, January 1, 2016 | 4322373000 | 3404000000 |
| Sunday, January 1, 2017 | 4940059000 | 3687100000 |
| Monday, January 1, 2018 | 4432562000 | 3793800000 |
| Tuesday, January 1, 2019 | 4515459000 | 3794700000 |
| Wednesday, January 1, 2020 | 4209741000 | 3734600000 |
| Friday, January 1, 2021 | 4937295000 | 4099700000 |
| Saturday, January 1, 2022 | 5444532000 | 4658400000 |
| Sunday, January 1, 2023 | 5353501000 | 5341000000 |
| Monday, January 1, 2024 | 4787288000 | 5070800000 |
In pursuit of knowledge
In the ever-evolving landscape of industrial automation and manufacturing, Rockwell Automation, Inc. and Dover Corporation stand as titans. Over the past decade, these companies have navigated the complexities of cost management with varying strategies. From 2014 to 2023, Dover Corporation's cost of revenue exhibited a steady climb, peaking in 2022 with a 28% increase from its 2016 low. Meanwhile, Rockwell Automation, Inc. showcased a more volatile trajectory, culminating in a remarkable 57% surge in 2023 compared to its 2016 figures. This divergence highlights the distinct operational approaches of these industry leaders. Notably, 2024 data for Dover Corporation remains elusive, leaving room for speculation on its future financial maneuvers. As these companies continue to innovate, understanding their cost structures offers invaluable insights into their competitive strategies and market positioning.
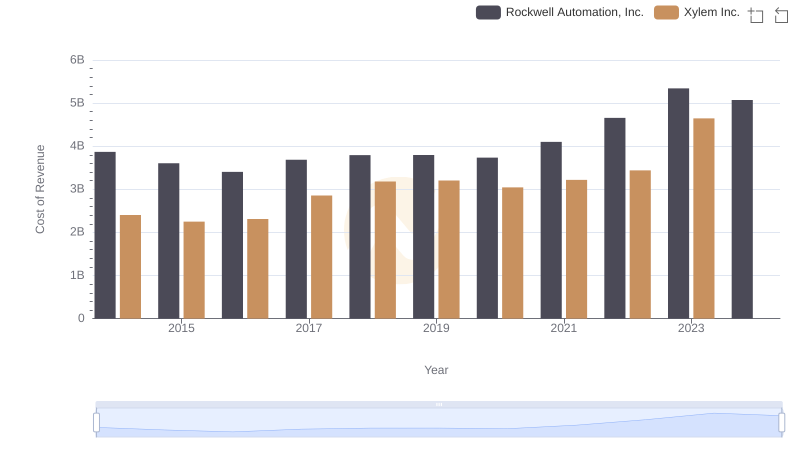
Analyzing Cost of Revenue: Rockwell Automation, Inc. and Xylem Inc.
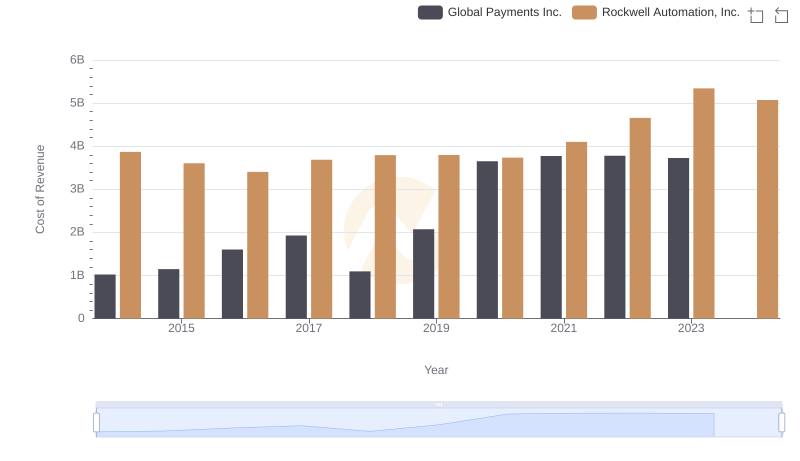
Rockwell Automation, Inc. vs Global Payments Inc.: Efficiency in Cost of Revenue Explored
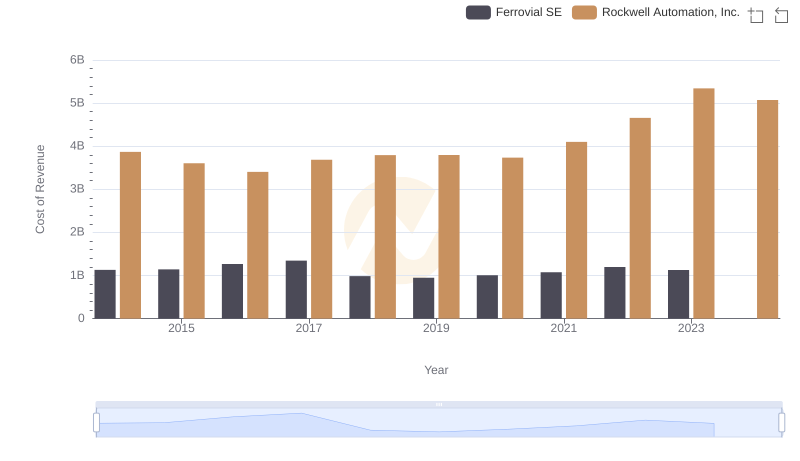
Comparing Cost of Revenue Efficiency: Rockwell Automation, Inc. vs Ferrovial SE
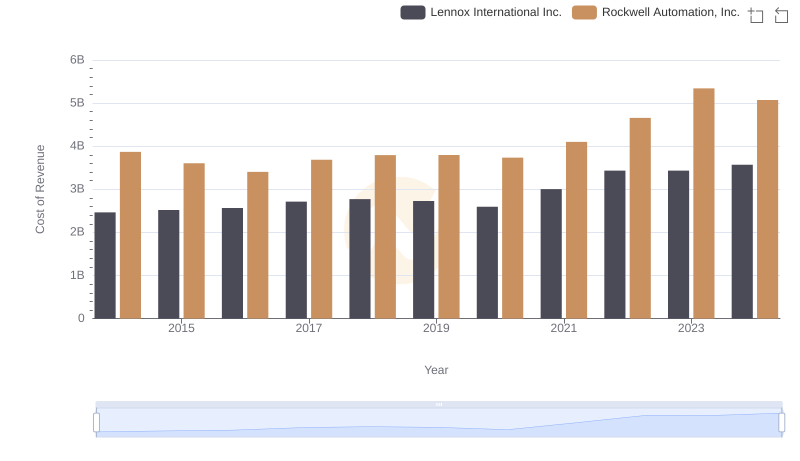
Cost of Revenue Trends: Rockwell Automation, Inc. vs Lennox International Inc.
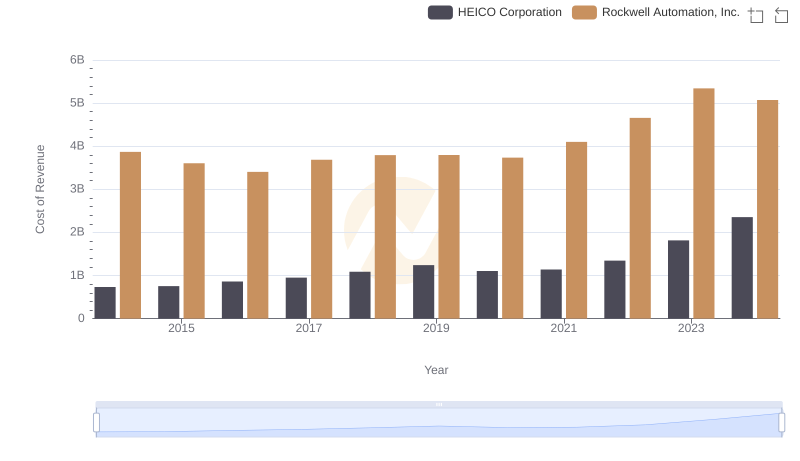
Analyzing Cost of Revenue: Rockwell Automation, Inc. and HEICO Corporation
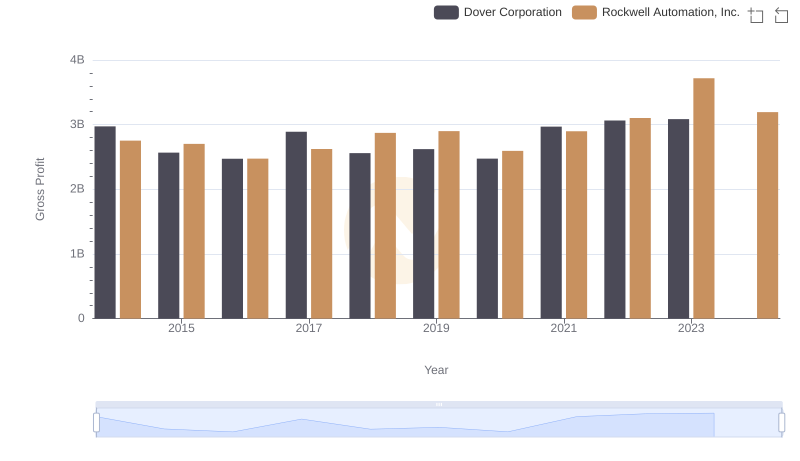
Gross Profit Analysis: Comparing Rockwell Automation, Inc. and Dover Corporation
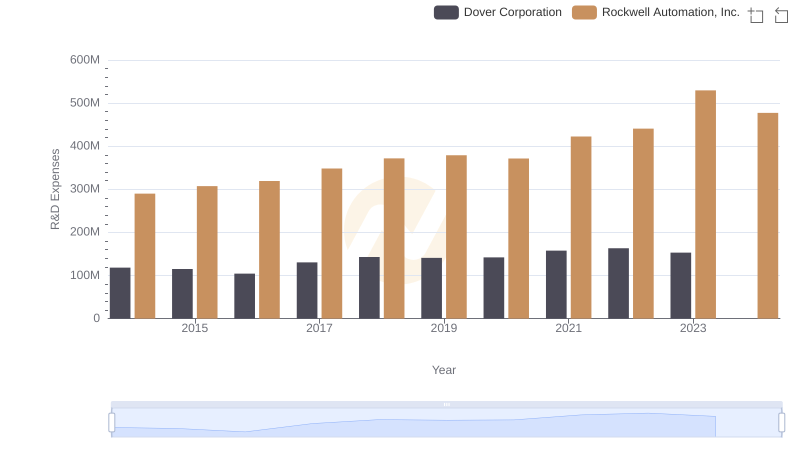
Analyzing R&D Budgets: Rockwell Automation, Inc. vs Dover Corporation
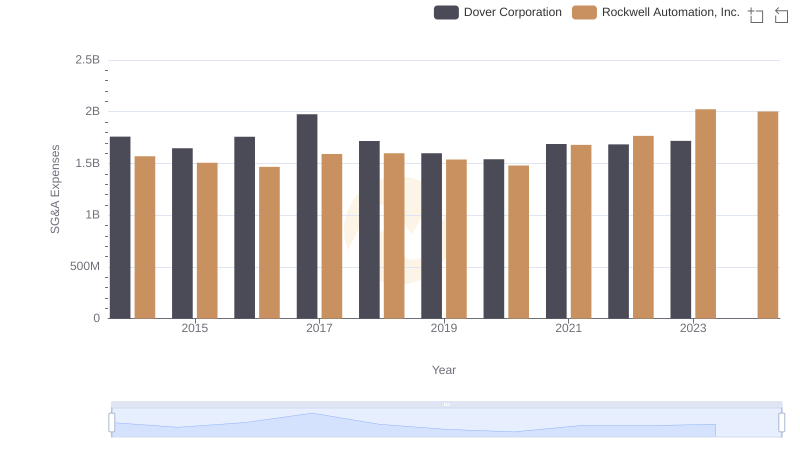
Cost Management Insights: SG&A Expenses for Rockwell Automation, Inc. and Dover Corporation
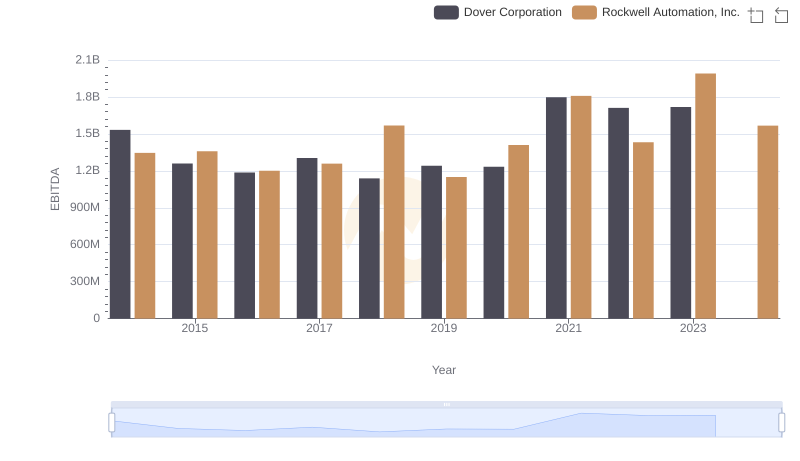
EBITDA Performance Review: Rockwell Automation, Inc. vs Dover Corporation