| __timestamp | CNH Industrial N.V. | EMCOR Group, Inc. |
|---|---|---|
| Wednesday, January 1, 2014 | 2591000000 | 355858000 |
| Thursday, January 1, 2015 | 1757000000 | 362095000 |
| Friday, January 1, 2016 | 1063000000 | 395913000 |
| Sunday, January 1, 2017 | 1715000000 | 478459000 |
| Monday, January 1, 2018 | 2339000000 | 489954000 |
| Tuesday, January 1, 2019 | 2077000000 | 556055000 |
| Wednesday, January 1, 2020 | 807000000 | 601449000 |
| Friday, January 1, 2021 | 2650000000 | 646861000 |
| Saturday, January 1, 2022 | 3447000000 | 682399000 |
| Sunday, January 1, 2023 | 5549000000 | 1009017000 |
Cracking the code
In the competitive landscape of industrial giants, EMCOR Group, Inc. and CNH Industrial N.V. have showcased intriguing EBITDA trends over the past decade. From 2014 to 2023, CNH Industrial N.V. experienced a remarkable 114% increase in EBITDA, peaking in 2023. This growth trajectory highlights CNH's strategic prowess in navigating market challenges and capitalizing on opportunities.
Conversely, EMCOR Group, Inc. demonstrated steady growth, with a 184% rise in EBITDA over the same period. This consistent upward trend underscores EMCOR's robust operational efficiency and adaptability in a dynamic market.
While CNH Industrial N.V. faced a dip in 2020, likely due to global disruptions, it rebounded strongly, emphasizing resilience. Meanwhile, EMCOR's gradual ascent reflects a stable and sustainable growth strategy. These insights offer a compelling narrative of how two industry leaders have maneuvered through economic ebbs and flows, setting benchmarks in financial performance.
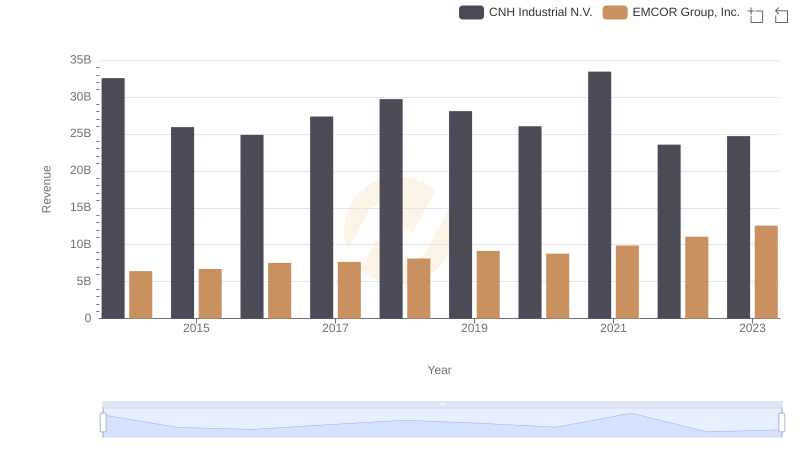
Comparing Revenue Performance: EMCOR Group, Inc. or CNH Industrial N.V.?
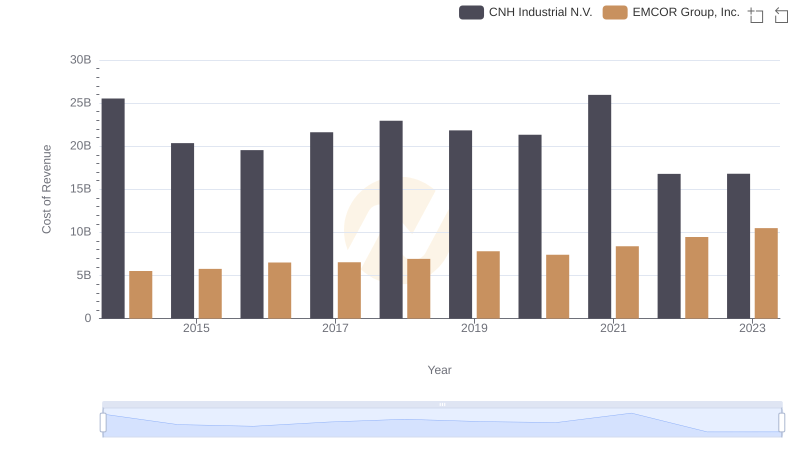
EMCOR Group, Inc. vs CNH Industrial N.V.: Efficiency in Cost of Revenue Explored
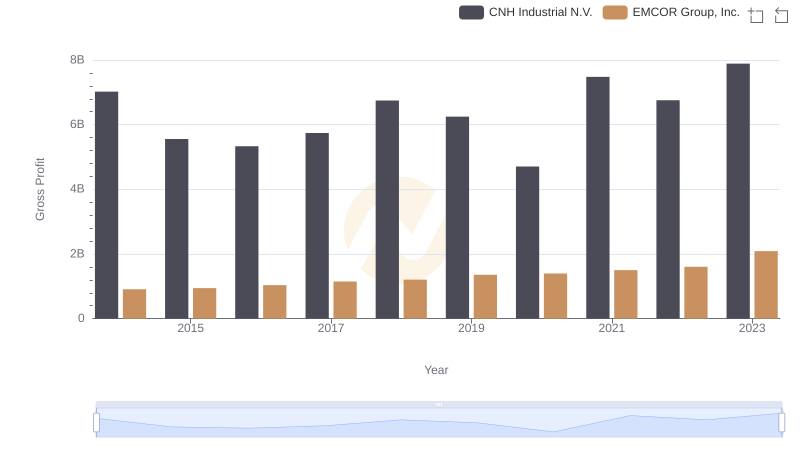
Key Insights on Gross Profit: EMCOR Group, Inc. vs CNH Industrial N.V.
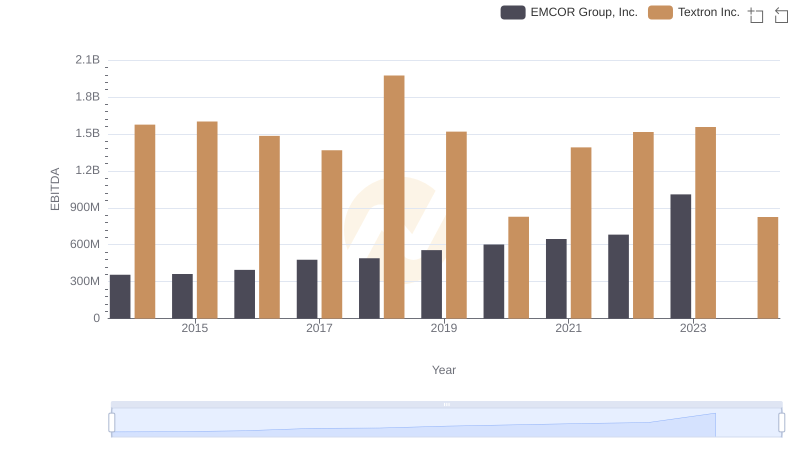
EBITDA Analysis: Evaluating EMCOR Group, Inc. Against Textron Inc.
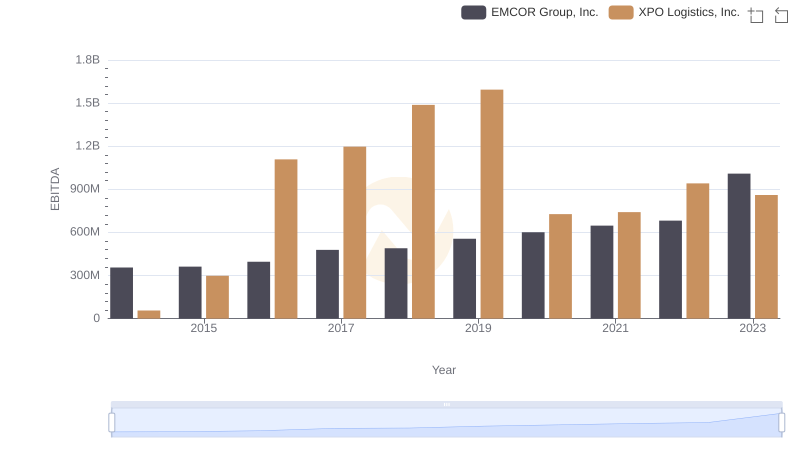
A Professional Review of EBITDA: EMCOR Group, Inc. Compared to XPO Logistics, Inc.
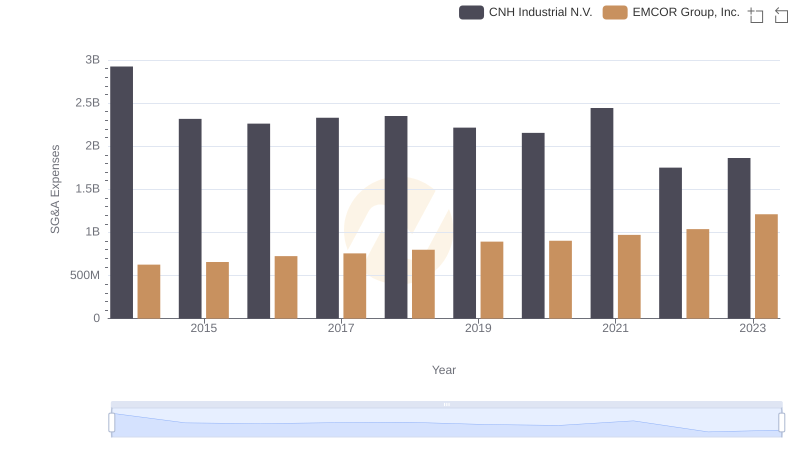
EMCOR Group, Inc. or CNH Industrial N.V.: Who Manages SG&A Costs Better?
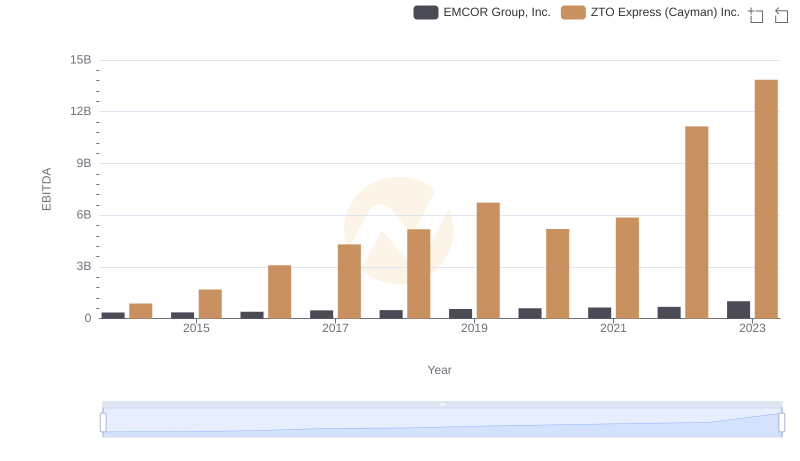
EMCOR Group, Inc. and ZTO Express (Cayman) Inc.: A Detailed Examination of EBITDA Performance
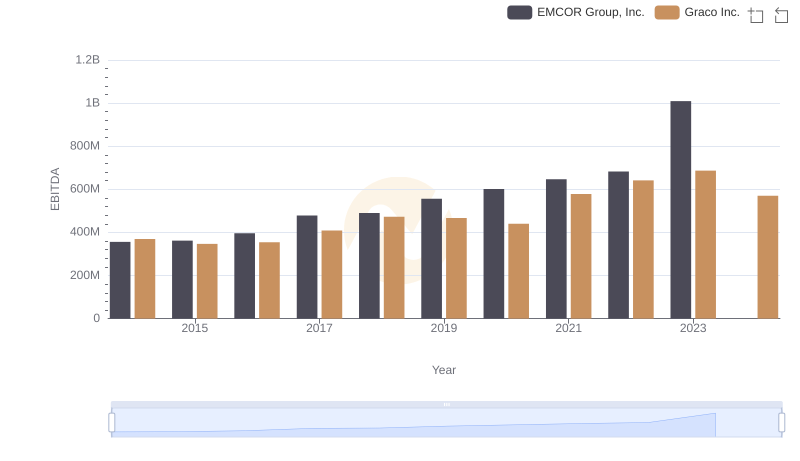
A Professional Review of EBITDA: EMCOR Group, Inc. Compared to Graco Inc.
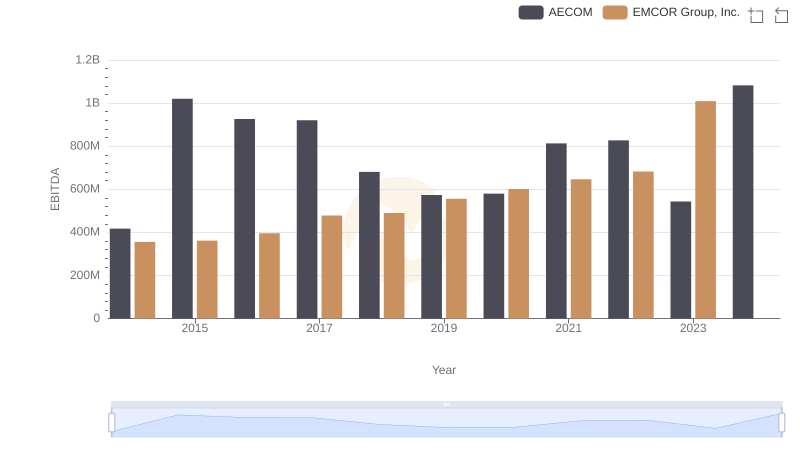
Comprehensive EBITDA Comparison: EMCOR Group, Inc. vs AECOM
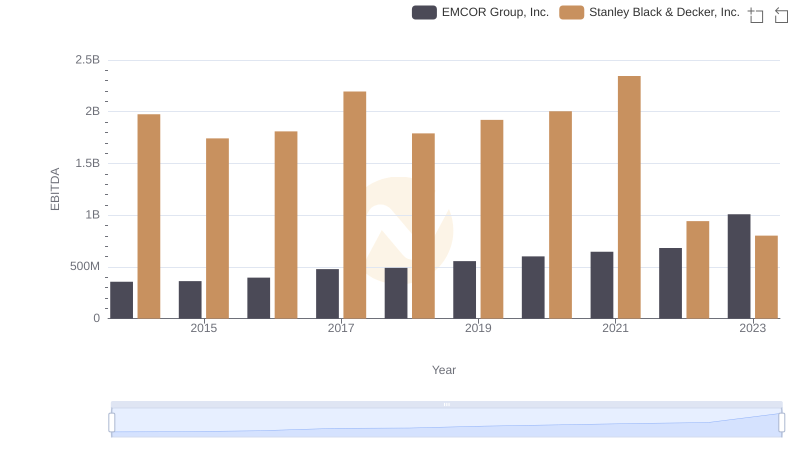
EMCOR Group, Inc. and Stanley Black & Decker, Inc.: A Detailed Examination of EBITDA Performance