| __timestamp | CNH Industrial N.V. | EMCOR Group, Inc. |
|---|---|---|
| Wednesday, January 1, 2014 | 7021000000 | 907246000 |
| Thursday, January 1, 2015 | 5555000000 | 944479000 |
| Friday, January 1, 2016 | 5333000000 | 1037862000 |
| Sunday, January 1, 2017 | 5740000000 | 1147012000 |
| Monday, January 1, 2018 | 6748000000 | 1205453000 |
| Tuesday, January 1, 2019 | 6247000000 | 1355868000 |
| Wednesday, January 1, 2020 | 4705000000 | 1395382000 |
| Friday, January 1, 2021 | 7477000000 | 1501737000 |
| Saturday, January 1, 2022 | 6754000000 | 1603594000 |
| Sunday, January 1, 2023 | 7889000000 | 2089339000 |
Igniting the spark of knowledge
In the competitive landscape of industrial giants, EMCOR Group, Inc. and CNH Industrial N.V. have showcased intriguing trends in gross profit over the past decade. From 2014 to 2023, CNH Industrial N.V. maintained a robust lead, with its gross profit peaking at approximately $7.9 billion in 2023, marking a 12% increase from 2014. Meanwhile, EMCOR Group, Inc. demonstrated a remarkable growth trajectory, with its gross profit surging by over 130% during the same period, reaching around $2.1 billion in 2023. This growth underscores EMCOR's strategic advancements and market adaptability. The data reveals a compelling narrative of resilience and expansion, highlighting the dynamic shifts within the industrial sector. As these companies continue to evolve, their financial performance offers valuable insights into broader economic trends and industry-specific challenges.
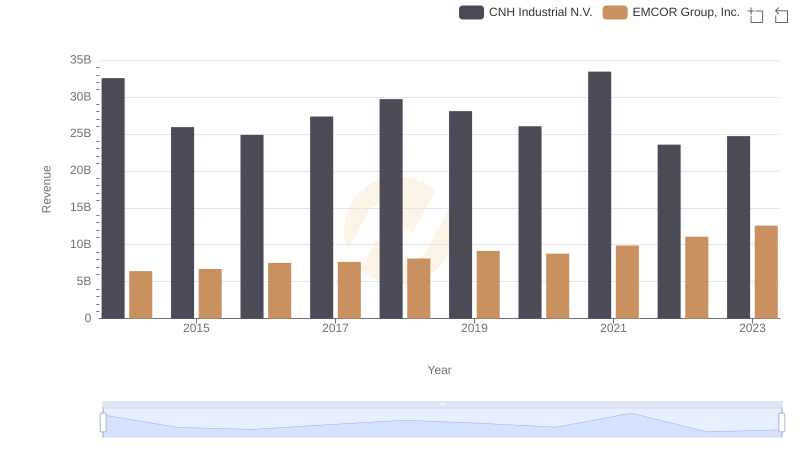
Comparing Revenue Performance: EMCOR Group, Inc. or CNH Industrial N.V.?
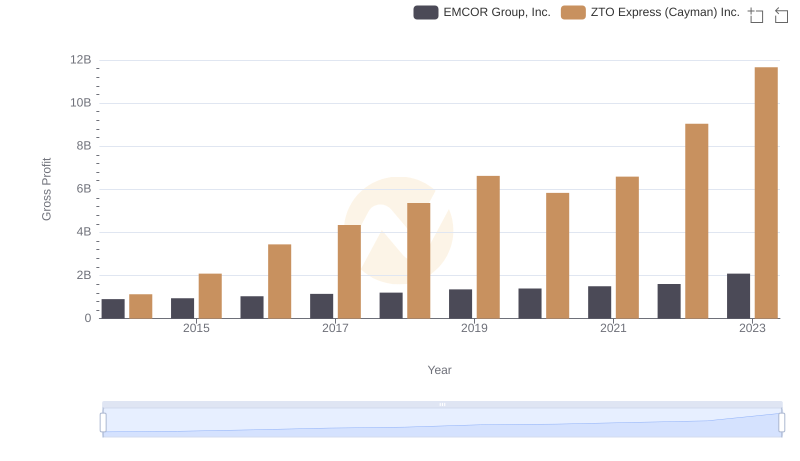
Gross Profit Comparison: EMCOR Group, Inc. and ZTO Express (Cayman) Inc. Trends
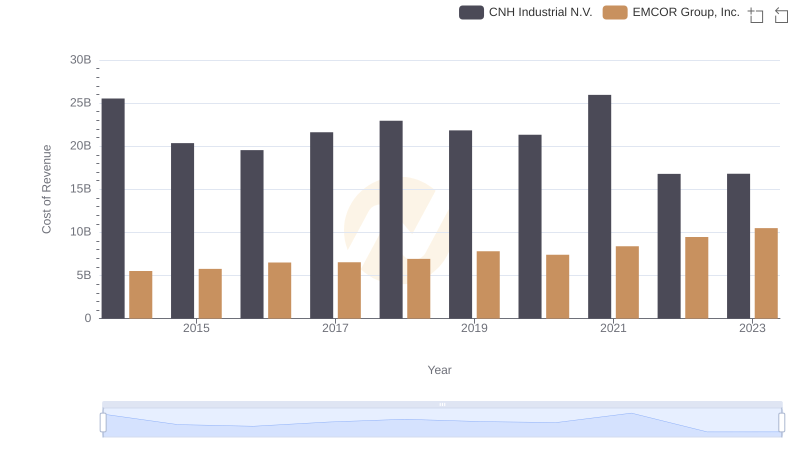
EMCOR Group, Inc. vs CNH Industrial N.V.: Efficiency in Cost of Revenue Explored
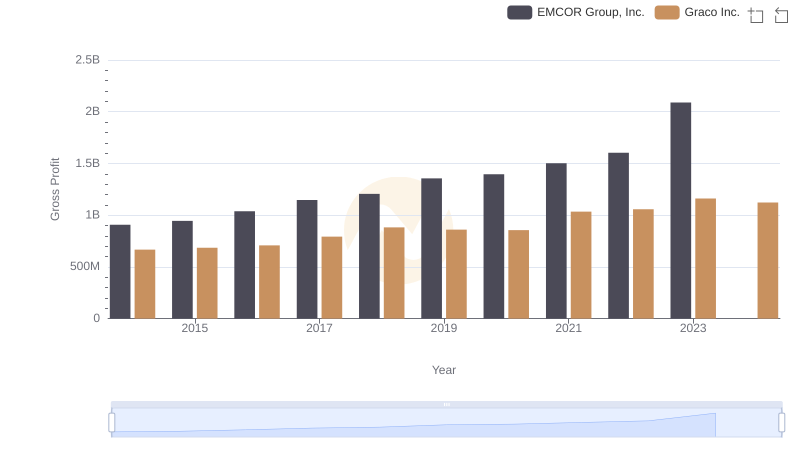
EMCOR Group, Inc. and Graco Inc.: A Detailed Gross Profit Analysis
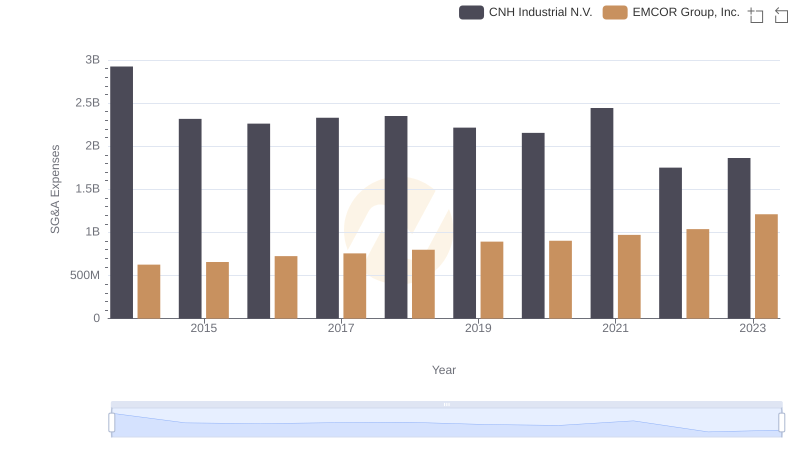
EMCOR Group, Inc. or CNH Industrial N.V.: Who Manages SG&A Costs Better?
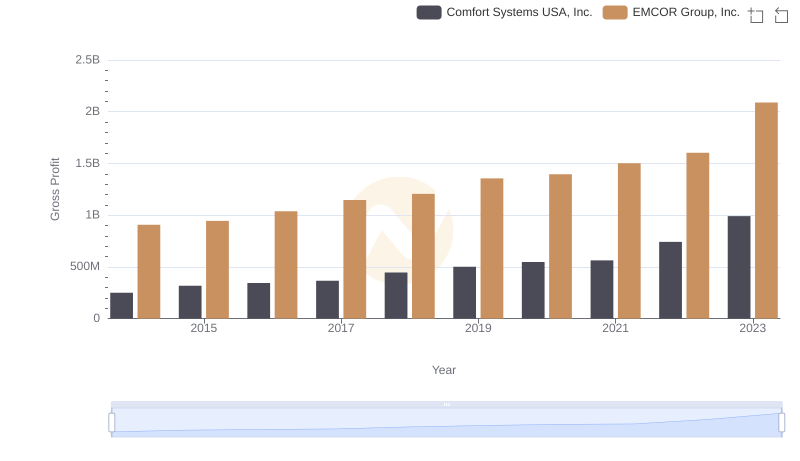
EMCOR Group, Inc. vs Comfort Systems USA, Inc.: A Gross Profit Performance Breakdown
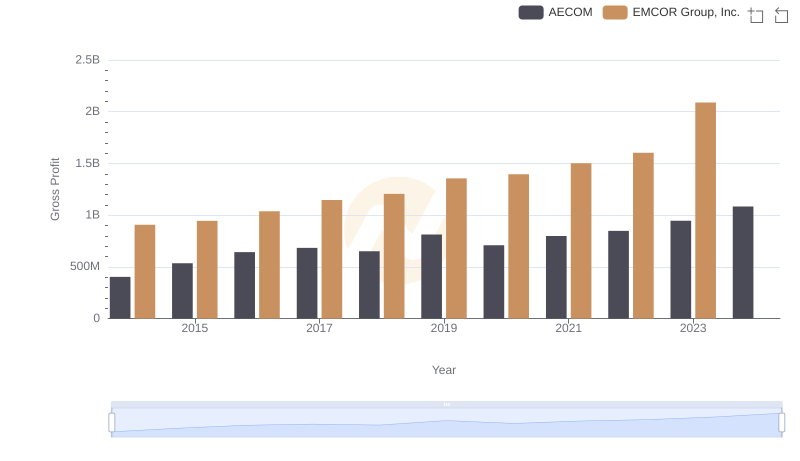
Who Generates Higher Gross Profit? EMCOR Group, Inc. or AECOM
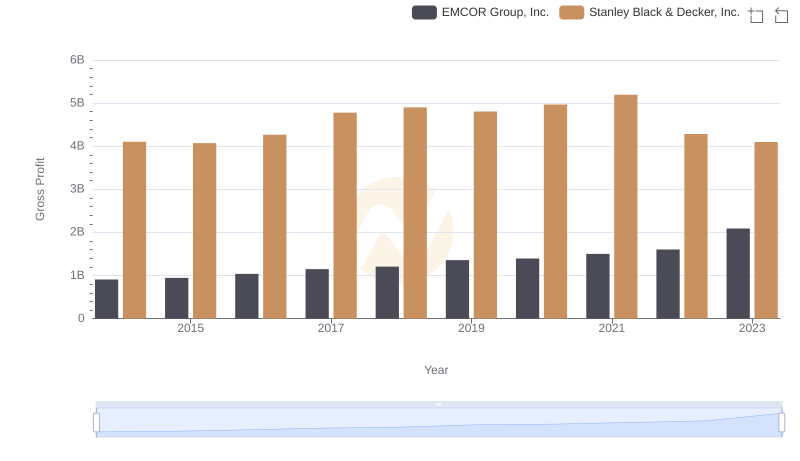
Gross Profit Comparison: EMCOR Group, Inc. and Stanley Black & Decker, Inc. Trends
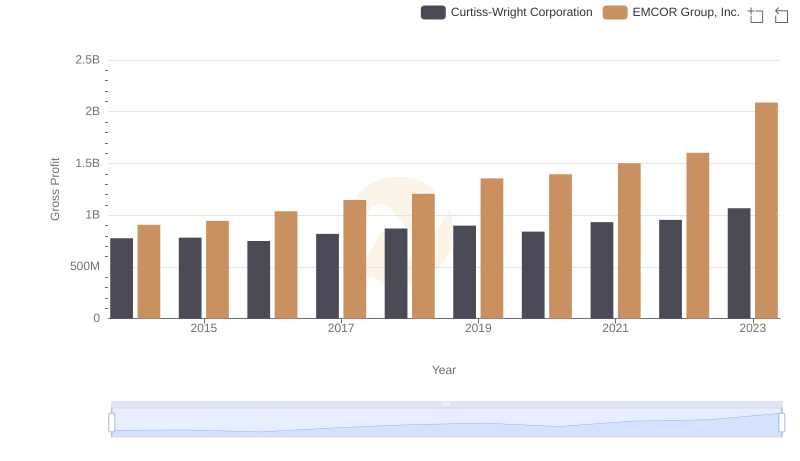
EMCOR Group, Inc. and Curtiss-Wright Corporation: A Detailed Gross Profit Analysis
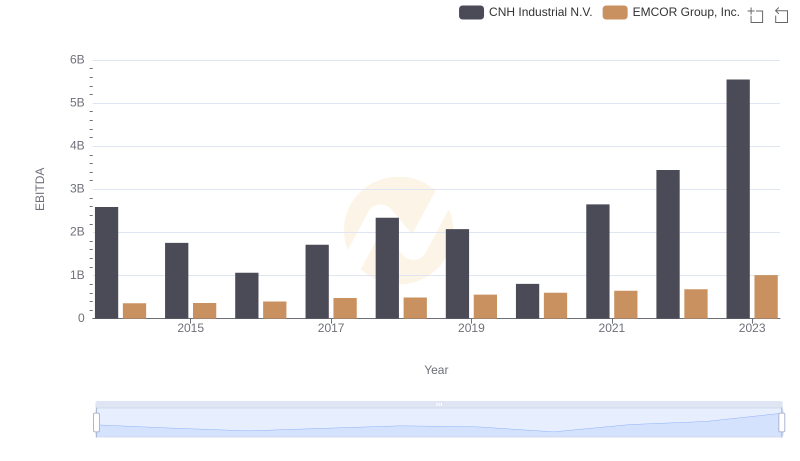
EBITDA Performance Review: EMCOR Group, Inc. vs CNH Industrial N.V.

Gross Profit Analysis: Comparing EMCOR Group, Inc. and U-Haul Holding Company