| __timestamp | CNH Industrial N.V. | EMCOR Group, Inc. |
|---|---|---|
| Wednesday, January 1, 2014 | 25534000000 | 5517719000 |
| Thursday, January 1, 2015 | 20357000000 | 5774247000 |
| Friday, January 1, 2016 | 19539000000 | 6513662000 |
| Sunday, January 1, 2017 | 21621000000 | 6539987000 |
| Monday, January 1, 2018 | 22958000000 | 6925178000 |
| Tuesday, January 1, 2019 | 21832000000 | 7818743000 |
| Wednesday, January 1, 2020 | 21327000000 | 7401679000 |
| Friday, January 1, 2021 | 25951000000 | 8401843000 |
| Saturday, January 1, 2022 | 16797000000 | 9472526000 |
| Sunday, January 1, 2023 | 16805000000 | 10493534000 |
Igniting the spark of knowledge
In the competitive landscape of industrial giants, cost efficiency is a critical metric. Over the past decade, EMCOR Group, Inc. and CNH Industrial N.V. have showcased contrasting trends in their cost of revenue. From 2014 to 2023, CNH Industrial N.V. experienced a notable decline of approximately 34% in its cost of revenue, dropping from a peak in 2014 to a low in 2022. Conversely, EMCOR Group, Inc. demonstrated a robust upward trajectory, with its cost of revenue surging by nearly 90% over the same period.
This divergence highlights EMCOR's aggressive growth strategy, while CNH Industrial's cost reduction efforts reflect a focus on operational efficiency. As the industrial sector evolves, these trends offer valuable insights into the strategic priorities of these two industry leaders. Understanding these dynamics is crucial for investors and stakeholders aiming to navigate the complexities of the industrial market.
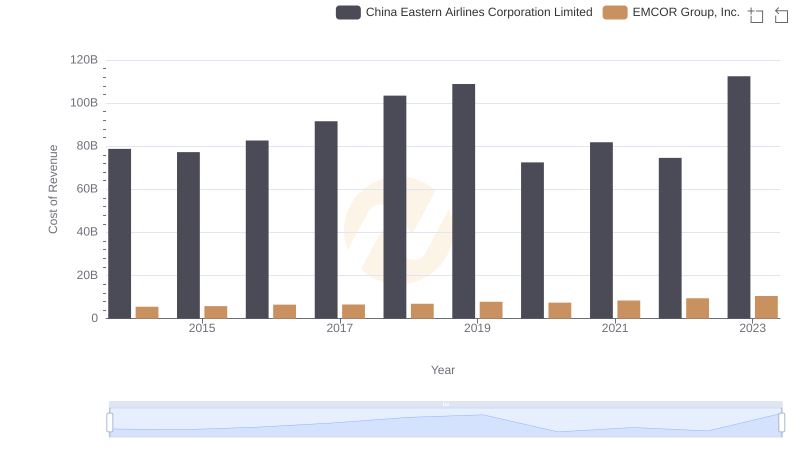
Cost of Revenue: Key Insights for EMCOR Group, Inc. and China Eastern Airlines Corporation Limited
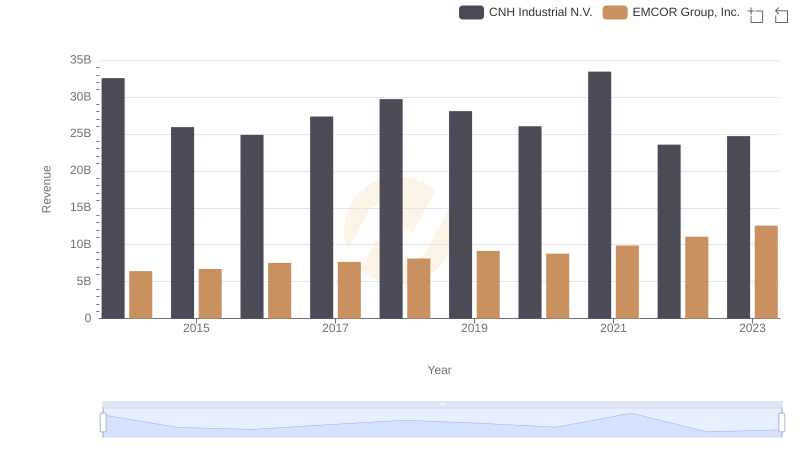
Comparing Revenue Performance: EMCOR Group, Inc. or CNH Industrial N.V.?
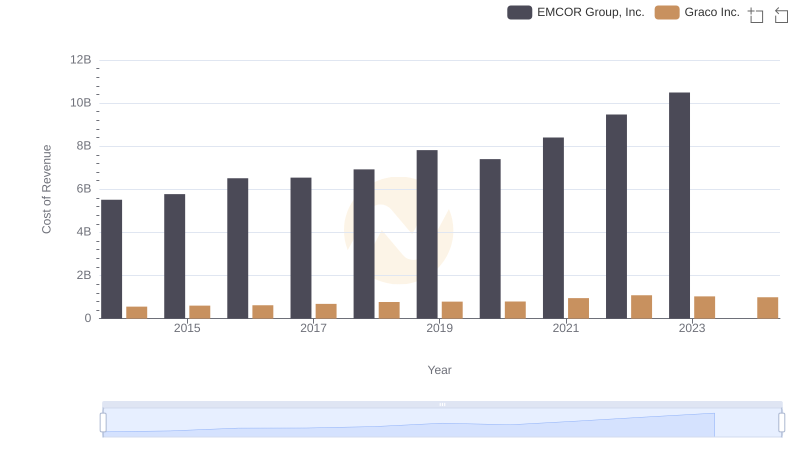
Cost of Revenue Trends: EMCOR Group, Inc. vs Graco Inc.
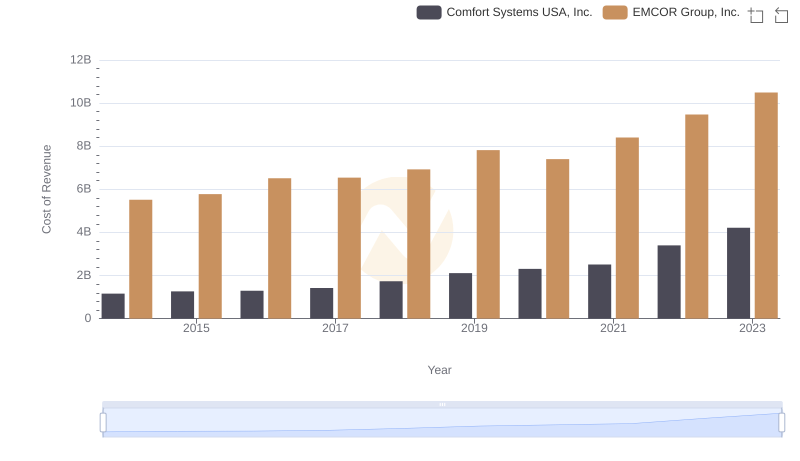
Cost of Revenue Trends: EMCOR Group, Inc. vs Comfort Systems USA, Inc.
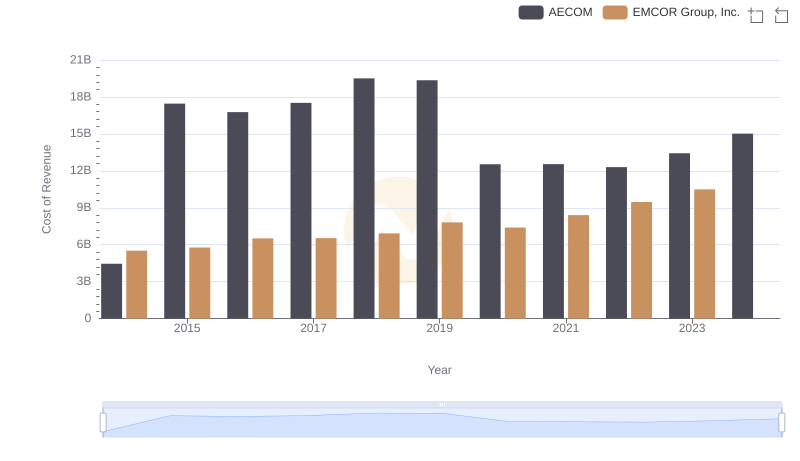
Cost of Revenue Trends: EMCOR Group, Inc. vs AECOM
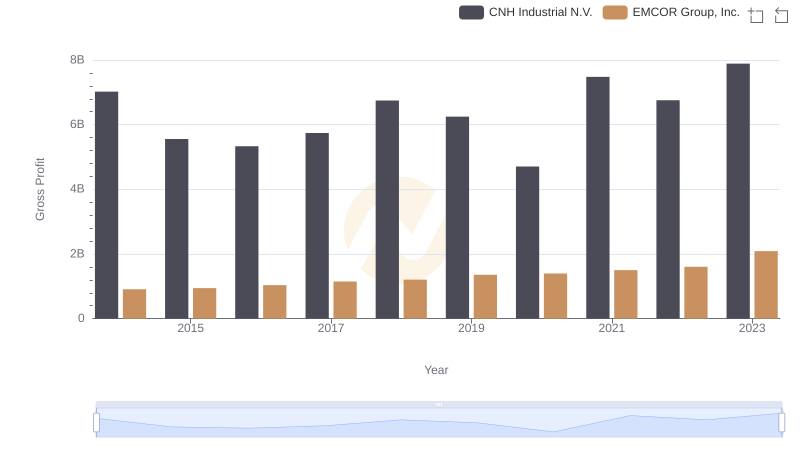
Key Insights on Gross Profit: EMCOR Group, Inc. vs CNH Industrial N.V.

Comparing Cost of Revenue Efficiency: EMCOR Group, Inc. vs Saia, Inc.
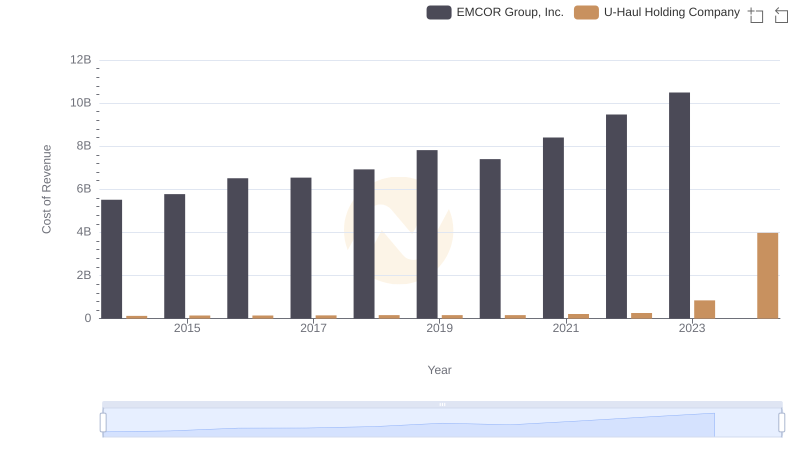
EMCOR Group, Inc. vs U-Haul Holding Company: Efficiency in Cost of Revenue Explored
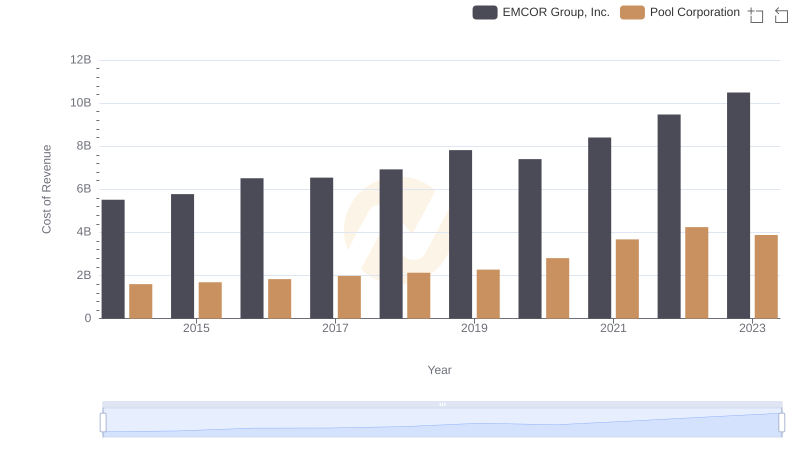
Cost of Revenue Comparison: EMCOR Group, Inc. vs Pool Corporation
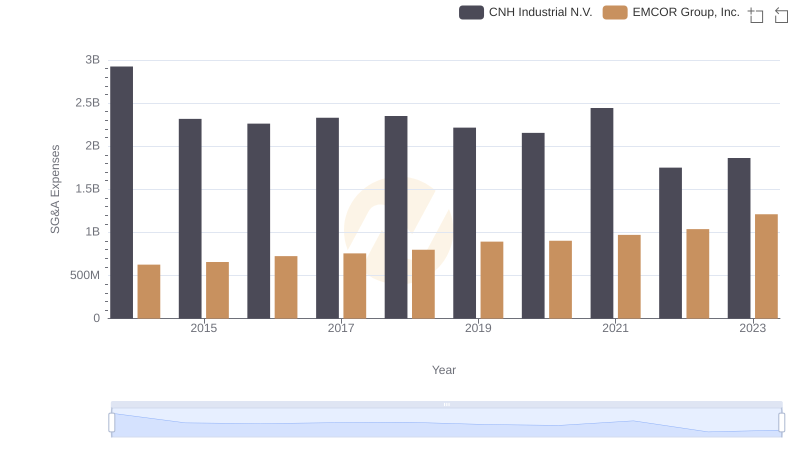
EMCOR Group, Inc. or CNH Industrial N.V.: Who Manages SG&A Costs Better?
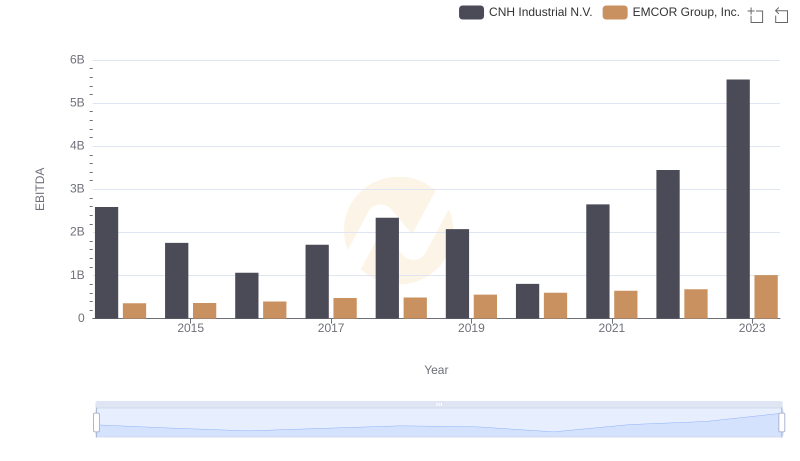
EBITDA Performance Review: EMCOR Group, Inc. vs CNH Industrial N.V.