| __timestamp | EMCOR Group, Inc. | Stanley Black & Decker, Inc. |
|---|---|---|
| Wednesday, January 1, 2014 | 355858000 | 1975400000 |
| Thursday, January 1, 2015 | 362095000 | 1741900000 |
| Friday, January 1, 2016 | 395913000 | 1810200000 |
| Sunday, January 1, 2017 | 478459000 | 2196000000 |
| Monday, January 1, 2018 | 489954000 | 1791200000 |
| Tuesday, January 1, 2019 | 556055000 | 1920600000 |
| Wednesday, January 1, 2020 | 601449000 | 2004200000 |
| Friday, January 1, 2021 | 646861000 | 2345500000 |
| Saturday, January 1, 2022 | 682399000 | 942800000 |
| Sunday, January 1, 2023 | 1009017000 | 802700000 |
| Monday, January 1, 2024 | 286300000 |
Unveiling the hidden dimensions of data
In the ever-evolving landscape of industrial and construction services, EMCOR Group, Inc. and Stanley Black & Decker, Inc. have emerged as formidable players. Over the past decade, these companies have showcased contrasting EBITDA trajectories, reflecting their unique market strategies and operational efficiencies.
From 2014 to 2023, EMCOR Group, Inc. has demonstrated a robust growth in EBITDA, with a remarkable increase of approximately 183%. This steady climb underscores EMCOR's strategic focus on expanding its service offerings and enhancing operational efficiencies.
Conversely, Stanley Black & Decker, Inc. experienced a more volatile EBITDA performance. Despite a peak in 2021, the company saw a significant decline by 2023, dropping by nearly 66% from its 2021 high. This fluctuation highlights the challenges faced in maintaining consistent profitability amidst market pressures.

Annual Revenue Comparison: EMCOR Group, Inc. vs Stanley Black & Decker, Inc.
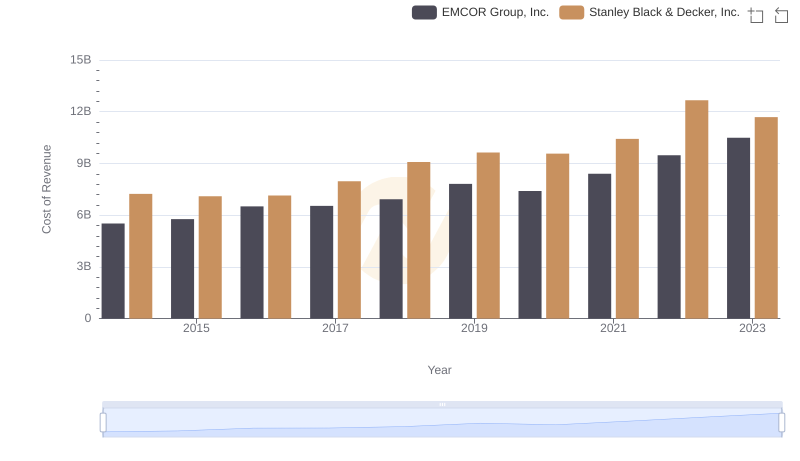
Cost of Revenue Trends: EMCOR Group, Inc. vs Stanley Black & Decker, Inc.
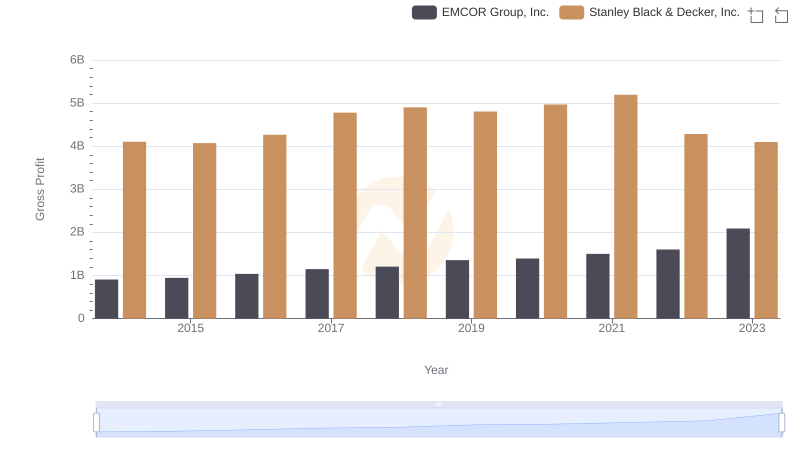
Key Insights on Gross Profit: EMCOR Group, Inc. vs Stanley Black & Decker, Inc.
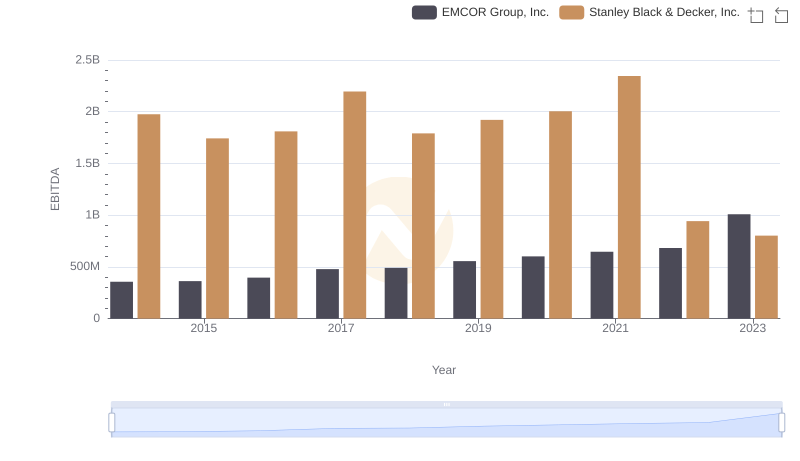
A Professional Review of EBITDA: EMCOR Group, Inc. Compared to Stanley Black & Decker, Inc.
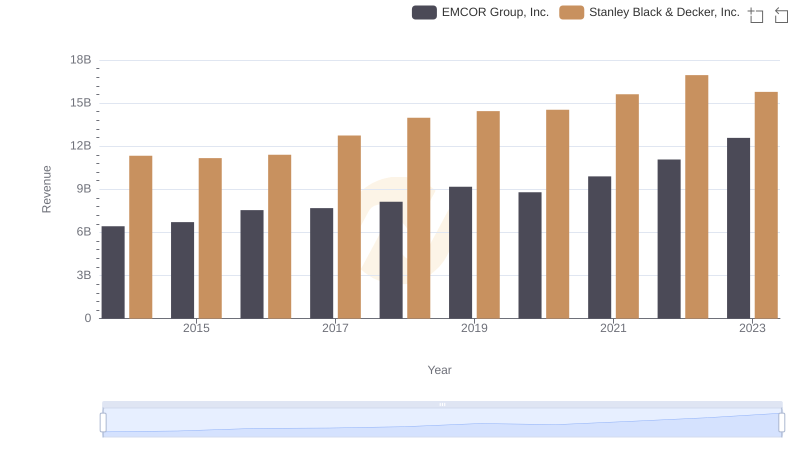
EMCOR Group, Inc. or Stanley Black & Decker, Inc.: Who Leads in Yearly Revenue?

Cost of Revenue: Key Insights for EMCOR Group, Inc. and Stanley Black & Decker, Inc.

Gross Profit Comparison: EMCOR Group, Inc. and Stanley Black & Decker, Inc. Trends
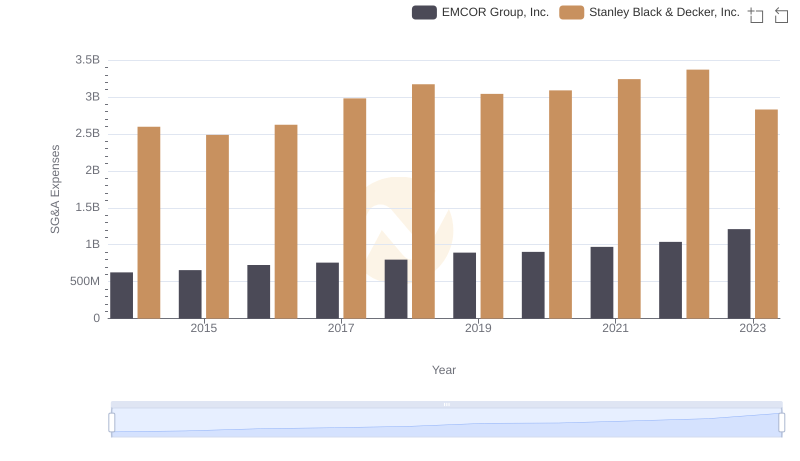
Selling, General, and Administrative Costs: EMCOR Group, Inc. vs Stanley Black & Decker, Inc.
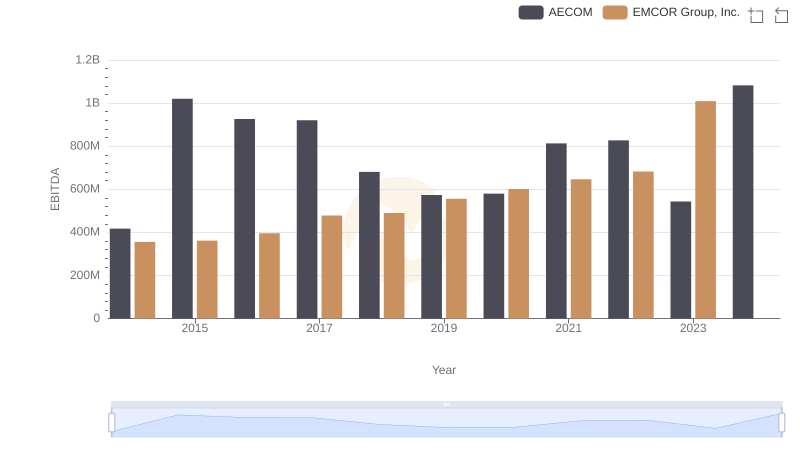
Comprehensive EBITDA Comparison: EMCOR Group, Inc. vs AECOM
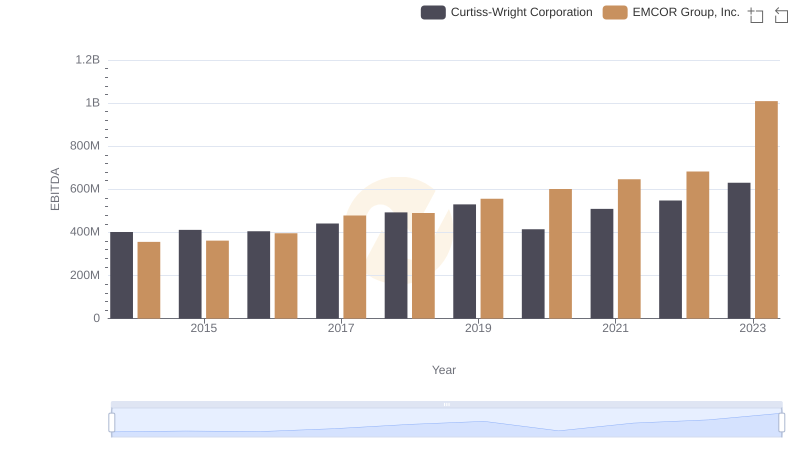
EBITDA Metrics Evaluated: EMCOR Group, Inc. vs Curtiss-Wright Corporation