| __timestamp | EMCOR Group, Inc. | XPO Logistics, Inc. |
|---|---|---|
| Wednesday, January 1, 2014 | 355858000 | 56600000 |
| Thursday, January 1, 2015 | 362095000 | 298000000 |
| Friday, January 1, 2016 | 395913000 | 1108300000 |
| Sunday, January 1, 2017 | 478459000 | 1196700000 |
| Monday, January 1, 2018 | 489954000 | 1488000000 |
| Tuesday, January 1, 2019 | 556055000 | 1594000000 |
| Wednesday, January 1, 2020 | 601449000 | 727000000 |
| Friday, January 1, 2021 | 646861000 | 741000000 |
| Saturday, January 1, 2022 | 682399000 | 941000000 |
| Sunday, January 1, 2023 | 1009017000 | 860000000 |
| Monday, January 1, 2024 | 1186000000 |
In pursuit of knowledge
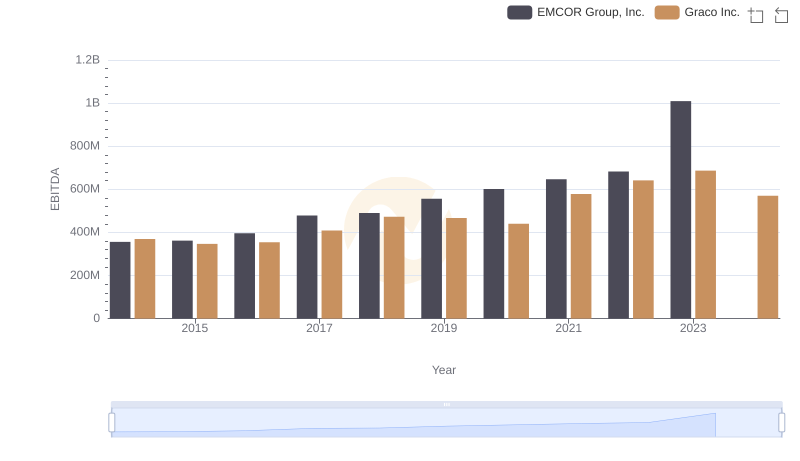
In the ever-evolving landscape of the U.S. stock market, understanding a company's financial health is crucial. EBITDA, or Earnings Before Interest, Taxes, Depreciation, and Amortization, serves as a key indicator of a company's operational performance. This article delves into the EBITDA trends of two industry giants, EMCOR Group, Inc. and XPO Logistics, Inc., from 2014 to 2023.
EMCOR Group, Inc. has shown a steady growth trajectory over the past decade. Starting with an EBITDA of approximately $356 million in 2014, the company has seen a remarkable increase, reaching over $1 billion by 2023. This represents a growth of nearly 183%, highlighting EMCOR's robust operational efficiency and strategic growth initiatives.
XPO Logistics, Inc. presents a more volatile yet impressive growth story. From a modest $57 million in 2014, XPO's EBITDA skyrocketed to $1.6 billion by 2019, before stabilizing around $860 million in 2023. Despite fluctuations, XPO's EBITDA grew by an astounding 1,409% over the decade, underscoring its aggressive expansion and market penetration strategies.
Both companies have demonstrated significant EBITDA growth, albeit through different trajectories. EMCOR's steady climb contrasts with XPO's rapid rise and subsequent stabilization, offering investors diverse insights into their operational strategies and market positions.
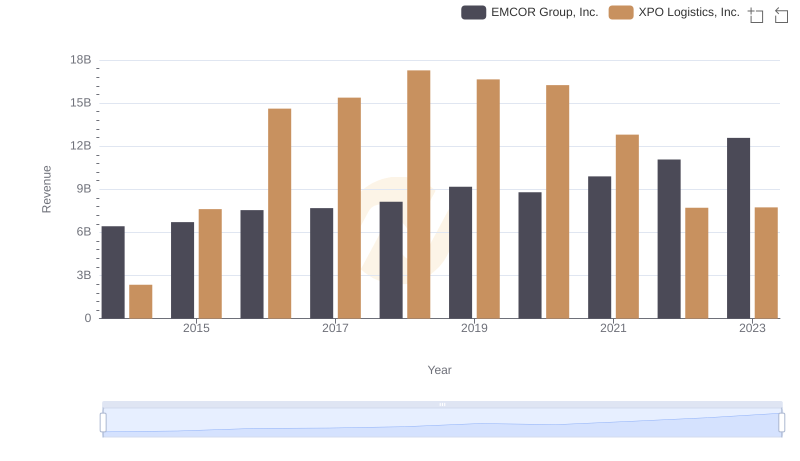
Annual Revenue Comparison: EMCOR Group, Inc. vs XPO Logistics, Inc.
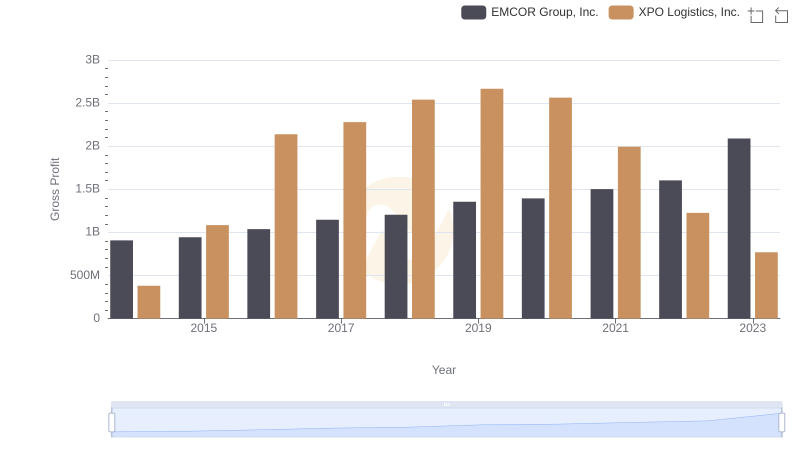
Gross Profit Comparison: EMCOR Group, Inc. and XPO Logistics, Inc. Trends
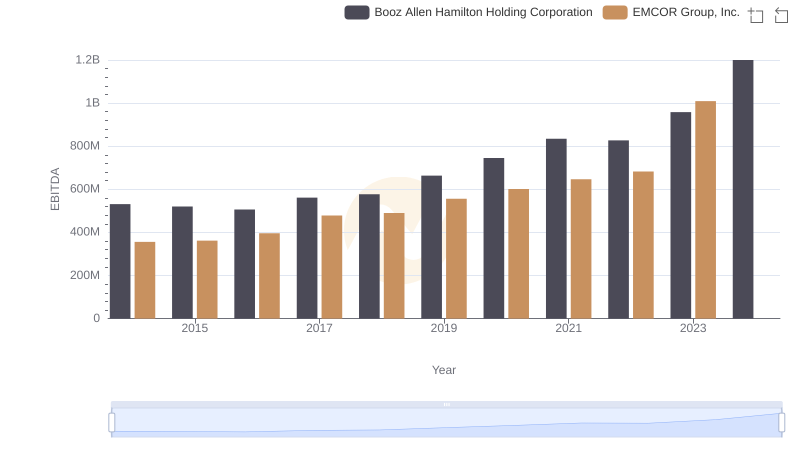
A Professional Review of EBITDA: EMCOR Group, Inc. Compared to Booz Allen Hamilton Holding Corporation
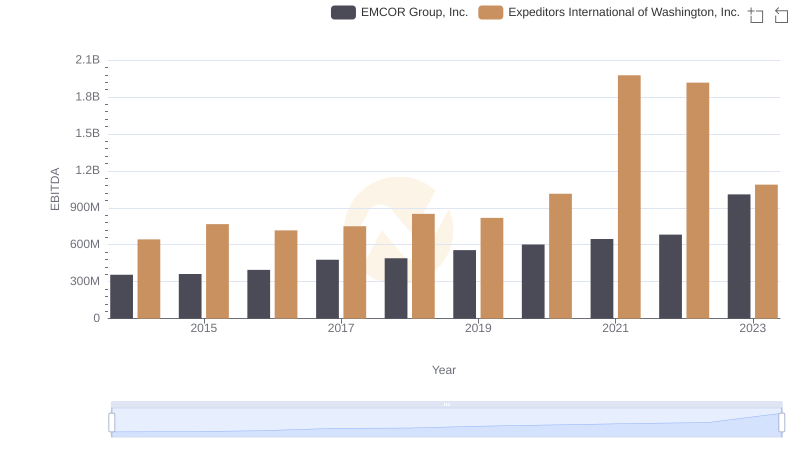
EBITDA Analysis: Evaluating EMCOR Group, Inc. Against Expeditors International of Washington, Inc.
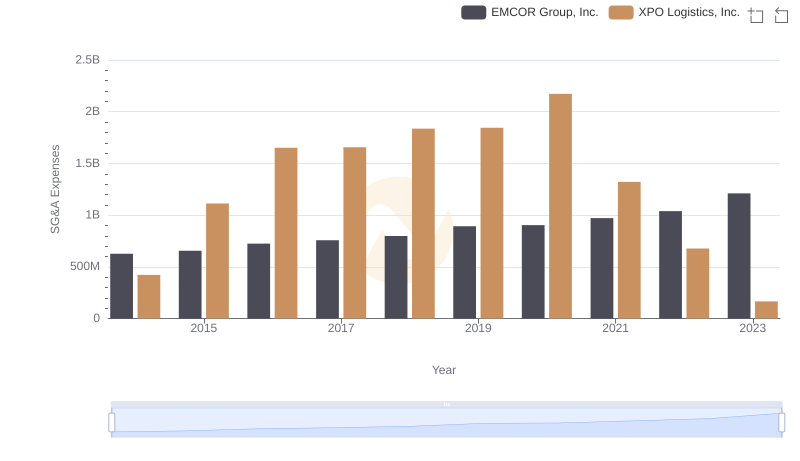
Selling, General, and Administrative Costs: EMCOR Group, Inc. vs XPO Logistics, Inc.
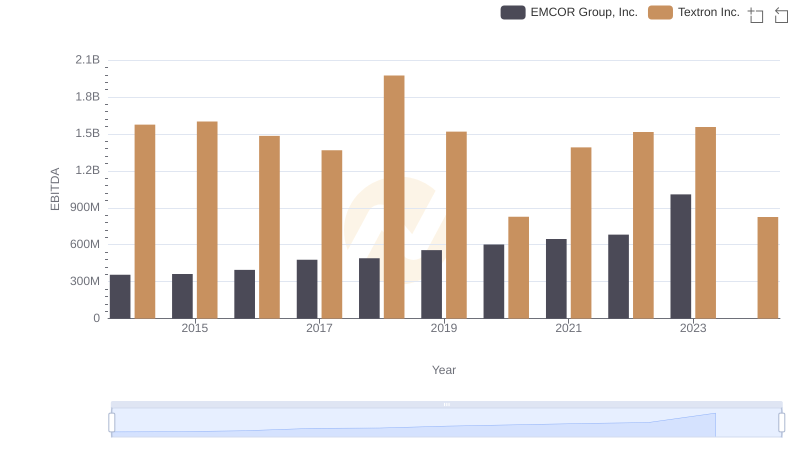
EBITDA Analysis: Evaluating EMCOR Group, Inc. Against Textron Inc.
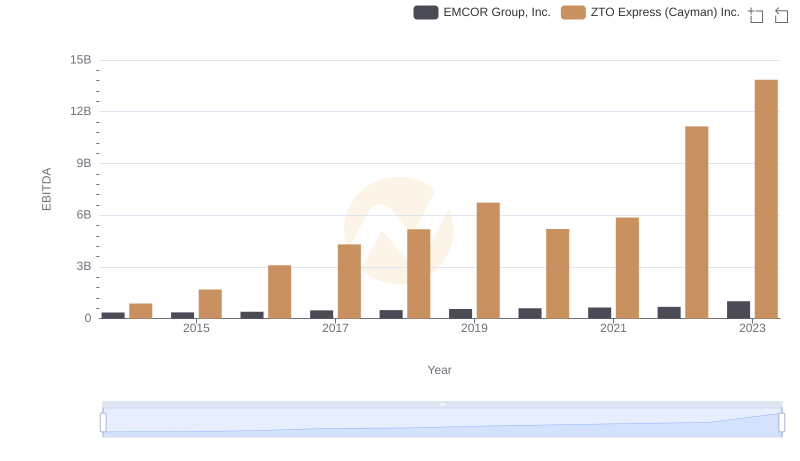
EMCOR Group, Inc. and ZTO Express (Cayman) Inc.: A Detailed Examination of EBITDA Performance
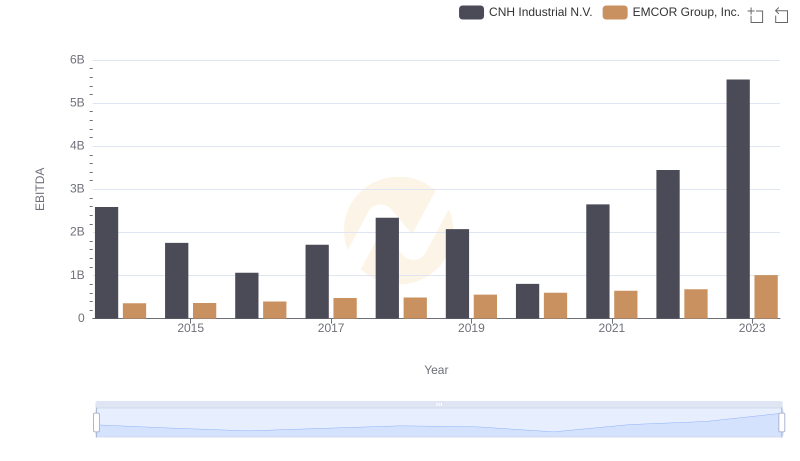
EBITDA Performance Review: EMCOR Group, Inc. vs CNH Industrial N.V.
A Professional Review of EBITDA: EMCOR Group, Inc. Compared to Graco Inc.