| __timestamp | EMCOR Group, Inc. | Graco Inc. |
|---|---|---|
| Wednesday, January 1, 2014 | 355858000 | 369321000 |
| Thursday, January 1, 2015 | 362095000 | 346732000 |
| Friday, January 1, 2016 | 395913000 | 354454000 |
| Sunday, January 1, 2017 | 478459000 | 408879000 |
| Monday, January 1, 2018 | 489954000 | 472905000 |
| Tuesday, January 1, 2019 | 556055000 | 466687000 |
| Wednesday, January 1, 2020 | 601449000 | 440431000 |
| Friday, January 1, 2021 | 646861000 | 578005000 |
| Saturday, January 1, 2022 | 682399000 | 641618000 |
| Sunday, January 1, 2023 | 1009017000 | 686593000 |
| Monday, January 1, 2024 | 570098000 |
Data in motion
In the ever-evolving landscape of industrial services and manufacturing, EMCOR Group, Inc. and Graco Inc. have emerged as key players. Over the past decade, EMCOR's EBITDA has shown a remarkable growth trajectory, surging by approximately 183% from 2014 to 2023. This growth underscores EMCOR's robust operational efficiency and strategic market positioning. In contrast, Graco Inc. has demonstrated a steady yet modest increase of around 86% in the same period, reflecting its consistent performance in the manufacturing sector.
The year 2023 marked a significant milestone for EMCOR, with its EBITDA peaking at over 1 billion, a testament to its resilience and adaptability in a competitive market. Meanwhile, Graco's EBITDA reached its highest in 2023, showcasing its sustained growth. However, the data for 2024 remains incomplete, leaving room for speculation on future trends.
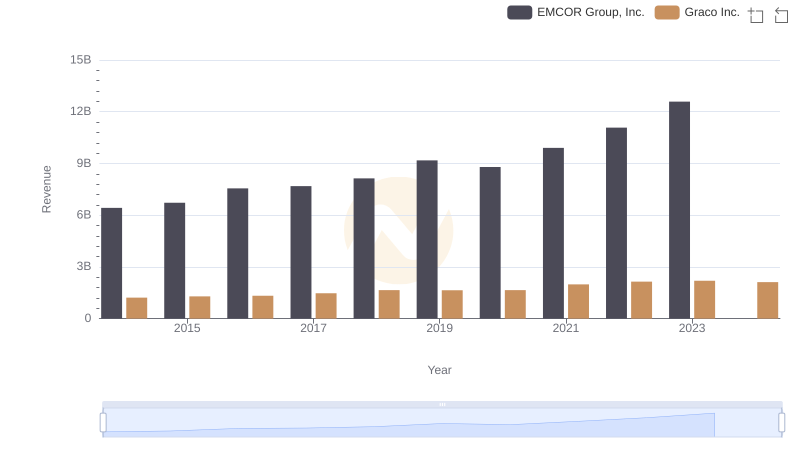
Annual Revenue Comparison: EMCOR Group, Inc. vs Graco Inc.
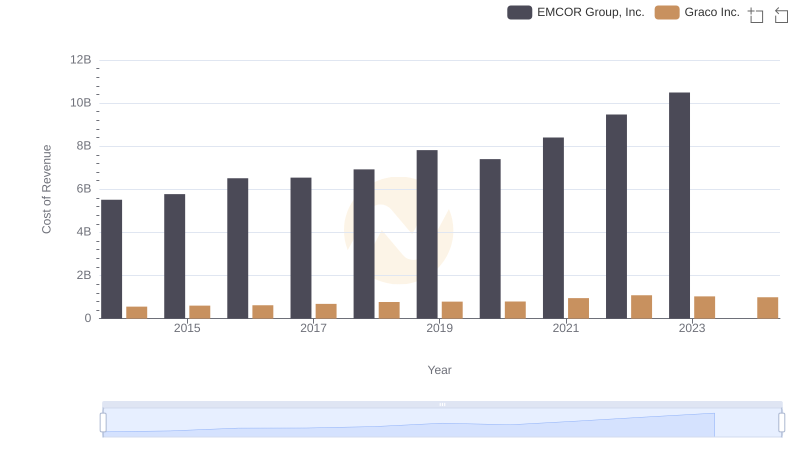
Cost of Revenue Trends: EMCOR Group, Inc. vs Graco Inc.
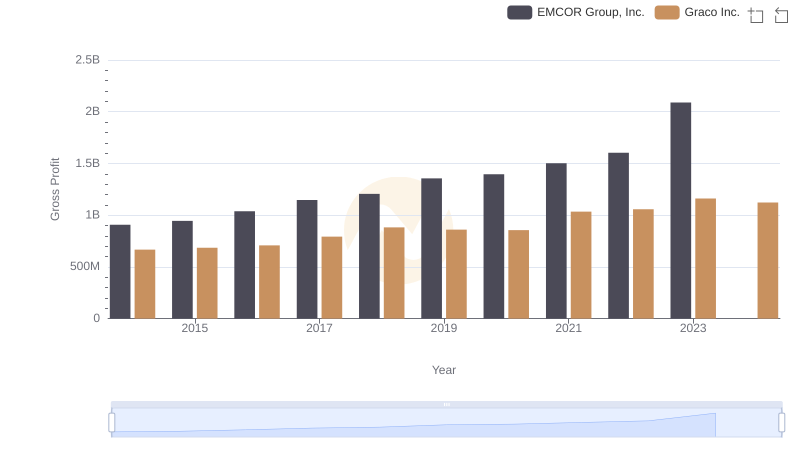
EMCOR Group, Inc. and Graco Inc.: A Detailed Gross Profit Analysis
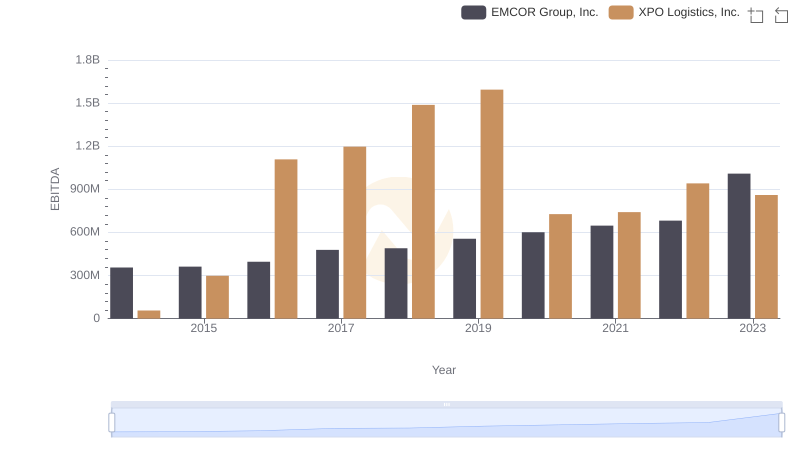
A Professional Review of EBITDA: EMCOR Group, Inc. Compared to XPO Logistics, Inc.
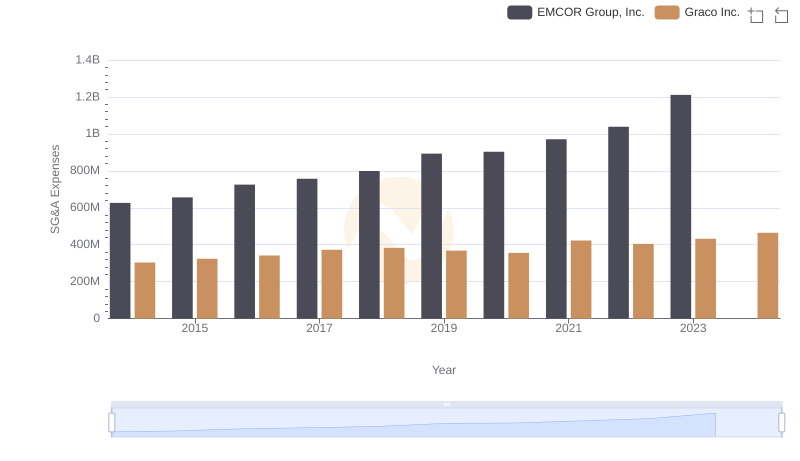
Breaking Down SG&A Expenses: EMCOR Group, Inc. vs Graco Inc.
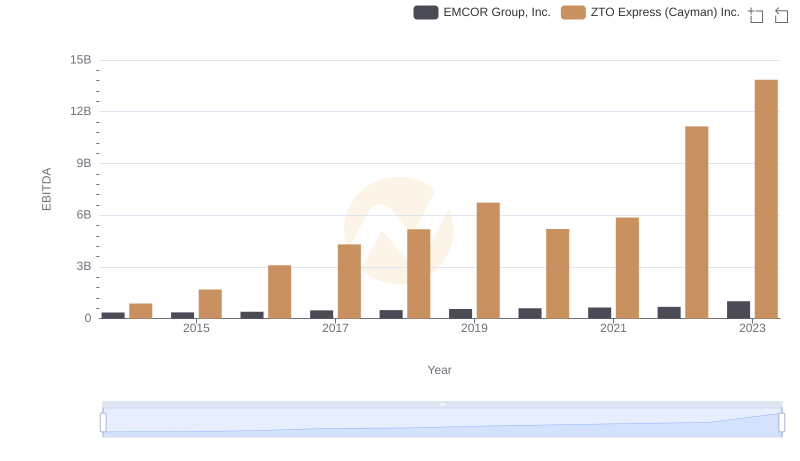
EMCOR Group, Inc. and ZTO Express (Cayman) Inc.: A Detailed Examination of EBITDA Performance
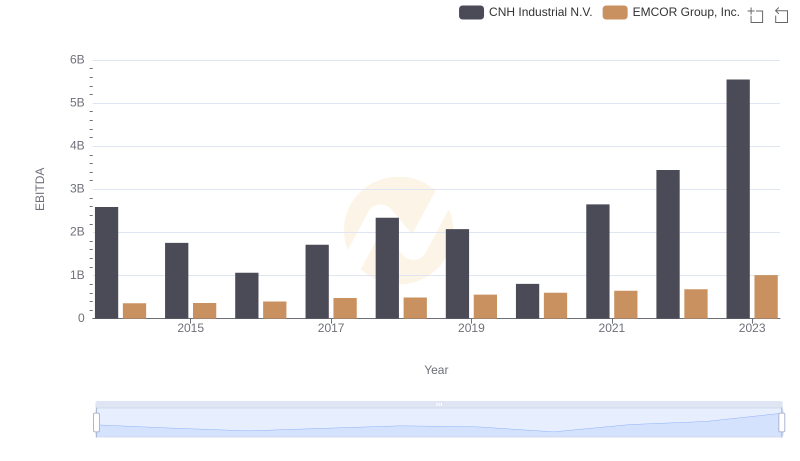
EBITDA Performance Review: EMCOR Group, Inc. vs CNH Industrial N.V.
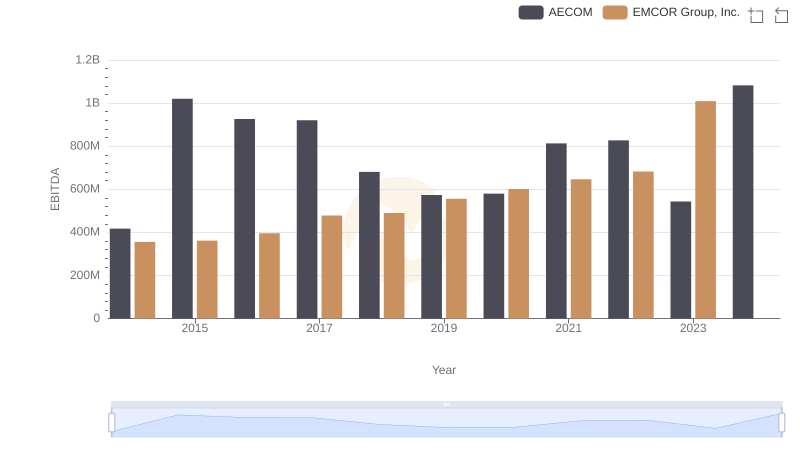
Comprehensive EBITDA Comparison: EMCOR Group, Inc. vs AECOM
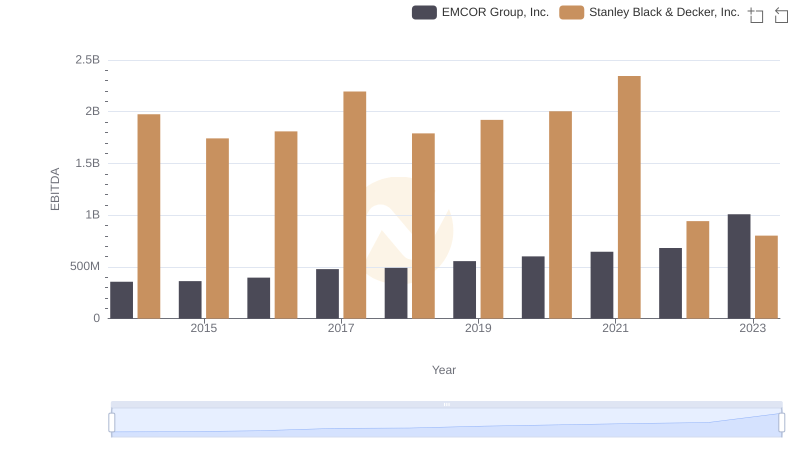
EMCOR Group, Inc. and Stanley Black & Decker, Inc.: A Detailed Examination of EBITDA Performance
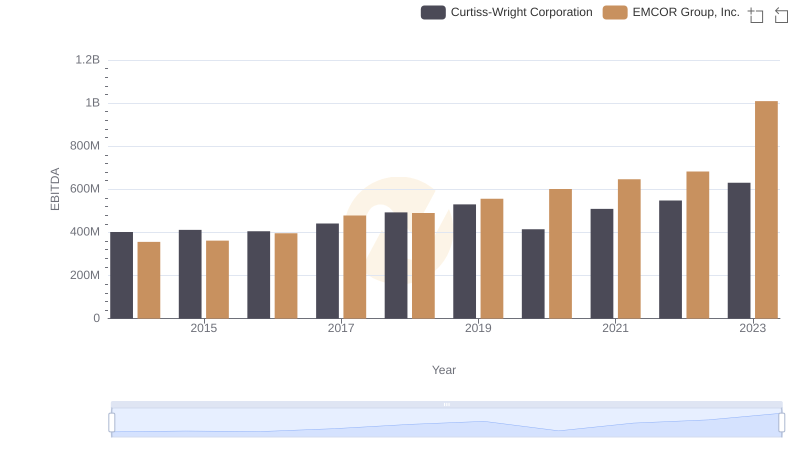
EBITDA Metrics Evaluated: EMCOR Group, Inc. vs Curtiss-Wright Corporation