| __timestamp | EMCOR Group, Inc. | Textron Inc. |
|---|---|---|
| Wednesday, January 1, 2014 | 355858000 | 1575000000 |
| Thursday, January 1, 2015 | 362095000 | 1601000000 |
| Friday, January 1, 2016 | 395913000 | 1484000000 |
| Sunday, January 1, 2017 | 478459000 | 1367000000 |
| Monday, January 1, 2018 | 489954000 | 1974000000 |
| Tuesday, January 1, 2019 | 556055000 | 1518000000 |
| Wednesday, January 1, 2020 | 601449000 | 827000000 |
| Friday, January 1, 2021 | 646861000 | 1391000000 |
| Saturday, January 1, 2022 | 682399000 | 1515000000 |
| Sunday, January 1, 2023 | 1009017000 | 1556000000 |
| Monday, January 1, 2024 | 1422000000 |
Unleashing the power of data
In the competitive landscape of the industrial sector, EMCOR Group, Inc. and Textron Inc. have showcased intriguing EBITDA trends over the past decade. From 2014 to 2023, EMCOR's EBITDA grew by approximately 183%, peaking at over $1 billion in 2023. This growth reflects EMCOR's strategic expansions and operational efficiencies. In contrast, Textron's EBITDA, while consistently higher, experienced fluctuations, with a notable dip in 2020, likely due to pandemic-related challenges, before stabilizing around $1.5 billion in 2023. This comparison highlights EMCOR's impressive growth trajectory, despite Textron's larger EBITDA base. However, the data for 2024 is incomplete, indicating potential volatility or reporting delays. Investors and analysts should consider these trends when evaluating the financial health and strategic direction of these industry giants.
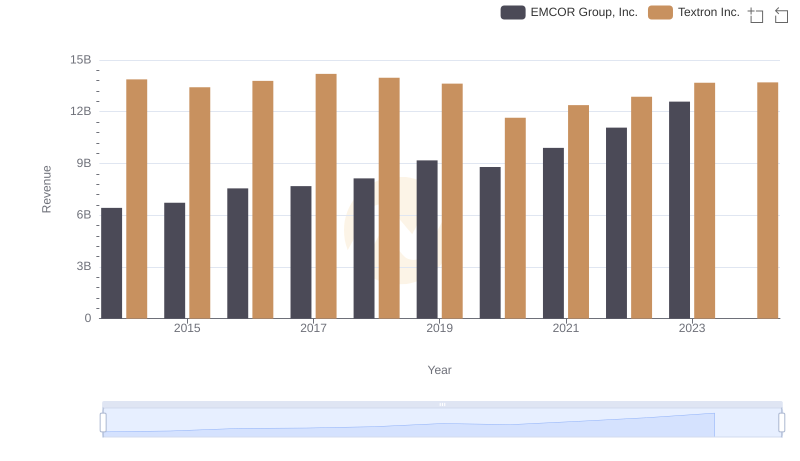
Who Generates More Revenue? EMCOR Group, Inc. or Textron Inc.
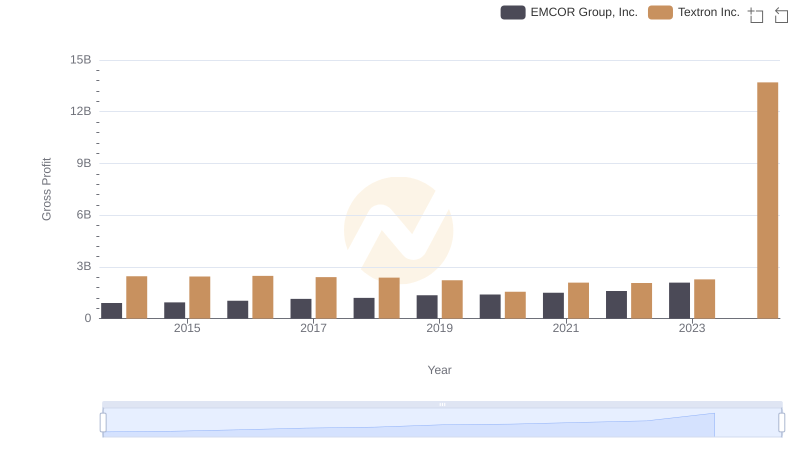
Gross Profit Comparison: EMCOR Group, Inc. and Textron Inc. Trends
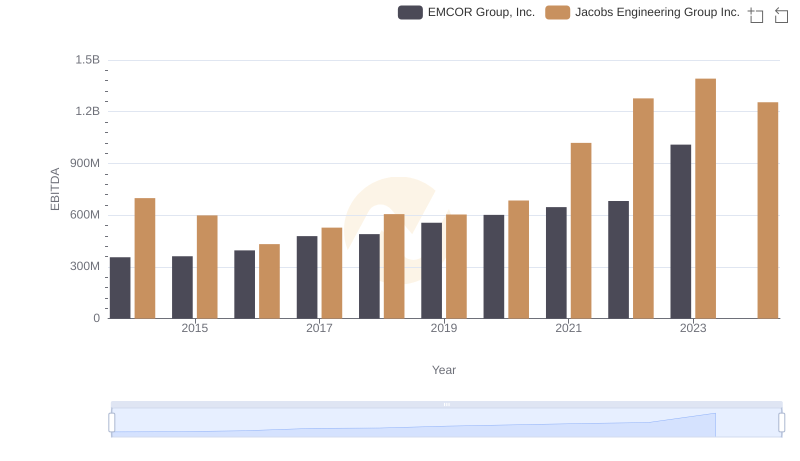
Comparative EBITDA Analysis: EMCOR Group, Inc. vs Jacobs Engineering Group Inc.
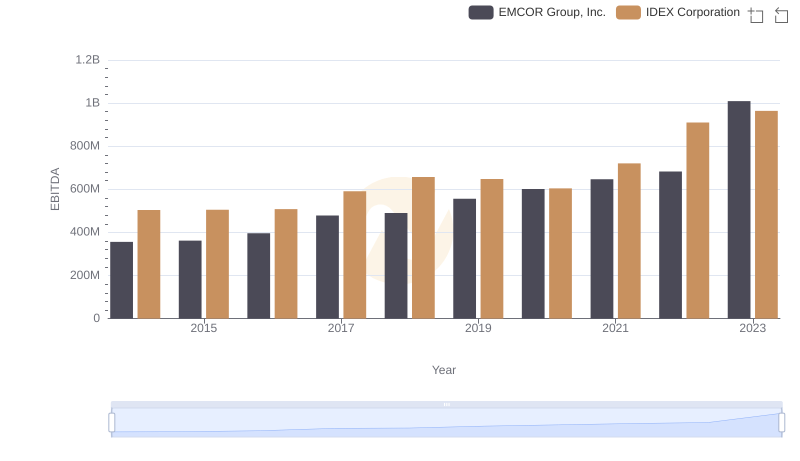
EBITDA Performance Review: EMCOR Group, Inc. vs IDEX Corporation
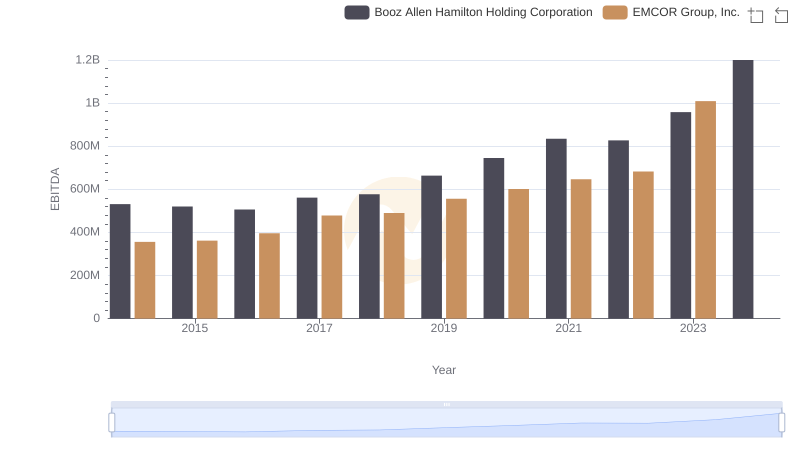
A Professional Review of EBITDA: EMCOR Group, Inc. Compared to Booz Allen Hamilton Holding Corporation
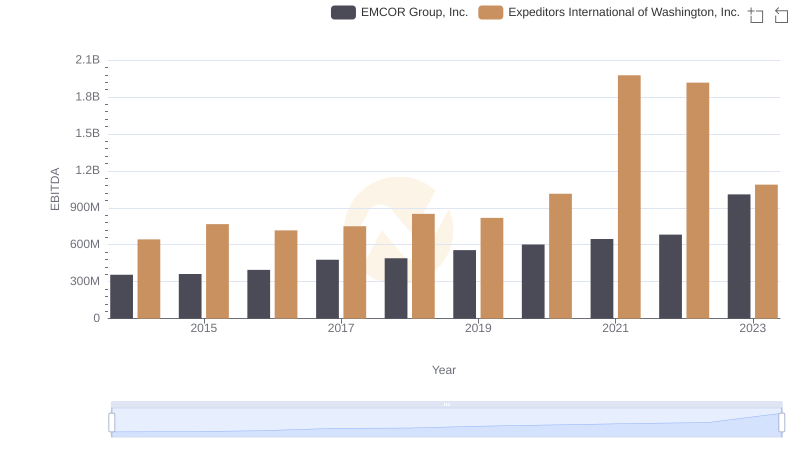
EBITDA Analysis: Evaluating EMCOR Group, Inc. Against Expeditors International of Washington, Inc.
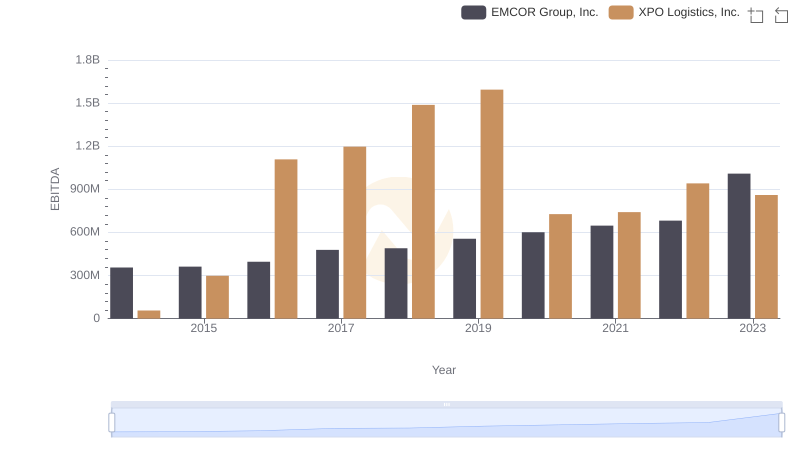
A Professional Review of EBITDA: EMCOR Group, Inc. Compared to XPO Logistics, Inc.
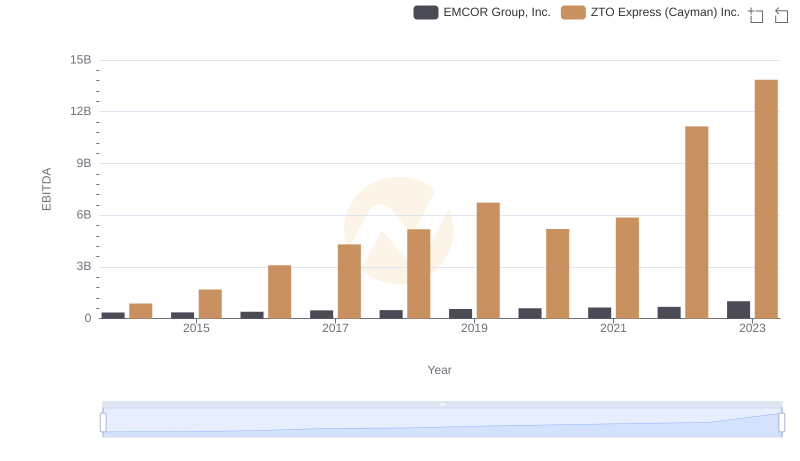
EMCOR Group, Inc. and ZTO Express (Cayman) Inc.: A Detailed Examination of EBITDA Performance
EBITDA Performance Review: EMCOR Group, Inc. vs CNH Industrial N.V.