| __timestamp | CNH Industrial N.V. | EMCOR Group, Inc. |
|---|---|---|
| Wednesday, January 1, 2014 | 32555000000 | 6424965000 |
| Thursday, January 1, 2015 | 25912000000 | 6718726000 |
| Friday, January 1, 2016 | 24872000000 | 7551524000 |
| Sunday, January 1, 2017 | 27361000000 | 7686999000 |
| Monday, January 1, 2018 | 29706000000 | 8130631000 |
| Tuesday, January 1, 2019 | 28079000000 | 9174611000 |
| Wednesday, January 1, 2020 | 26032000000 | 8797061000 |
| Friday, January 1, 2021 | 33428000000 | 9903580000 |
| Saturday, January 1, 2022 | 23551000000 | 11076120000 |
| Sunday, January 1, 2023 | 24694000000 | 12582873000 |
Cracking the code
In the ever-evolving landscape of industrial giants, EMCOR Group, Inc. and CNH Industrial N.V. have been pivotal players. Over the past decade, these companies have showcased contrasting revenue trajectories. From 2014 to 2023, CNH Industrial N.V. experienced a revenue decline of approximately 24%, starting at a peak in 2014 and dipping to its lowest in 2022. In contrast, EMCOR Group, Inc. demonstrated a robust growth pattern, with revenues surging by nearly 96% over the same period. This remarkable growth trajectory highlights EMCOR's strategic prowess in navigating market challenges. As of 2023, EMCOR's revenue reached its zenith, underscoring its resilience and adaptability. This comparison not only reflects the dynamic nature of the industrial sector but also emphasizes the importance of strategic agility in maintaining competitive advantage.
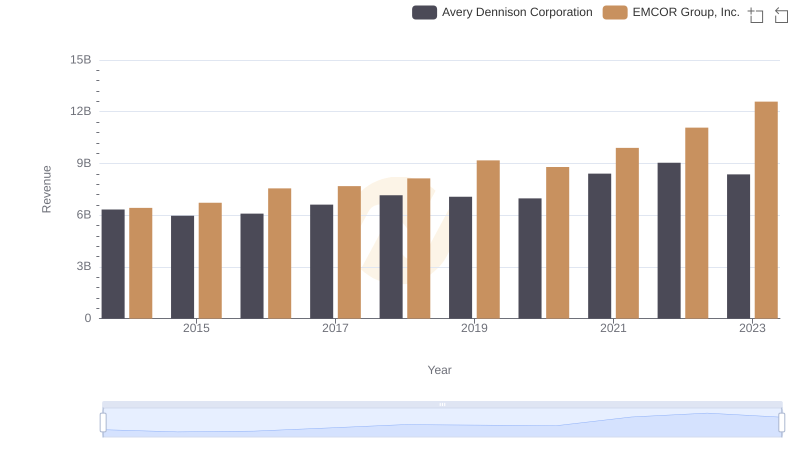
Comparing Revenue Performance: EMCOR Group, Inc. or Avery Dennison Corporation?
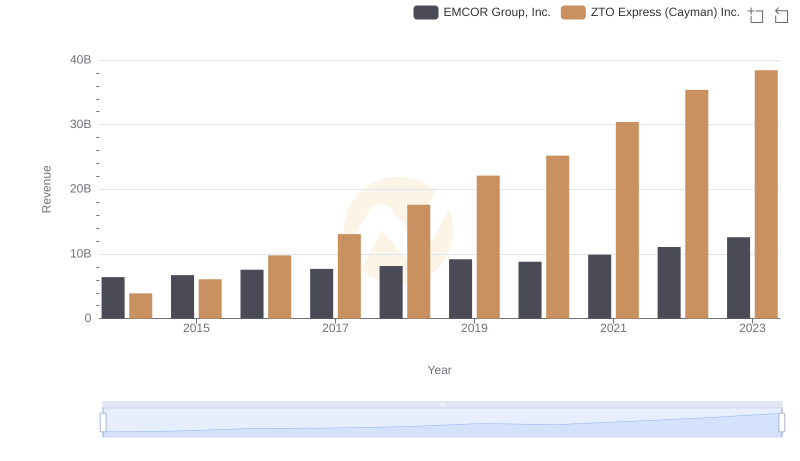
Breaking Down Revenue Trends: EMCOR Group, Inc. vs ZTO Express (Cayman) Inc.
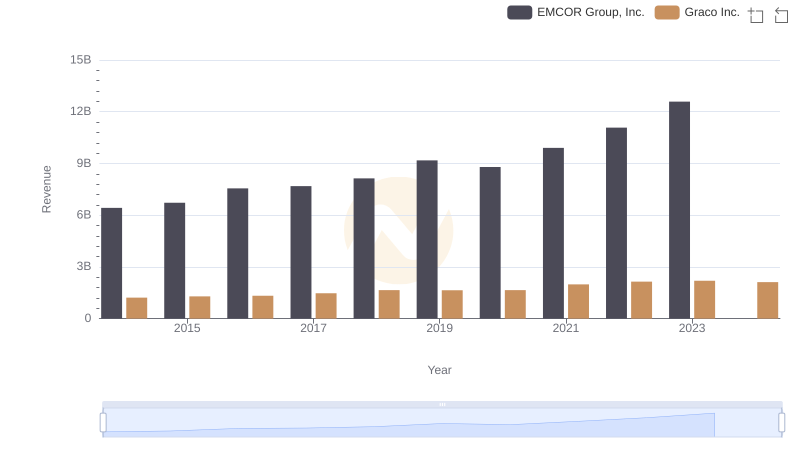
Annual Revenue Comparison: EMCOR Group, Inc. vs Graco Inc.
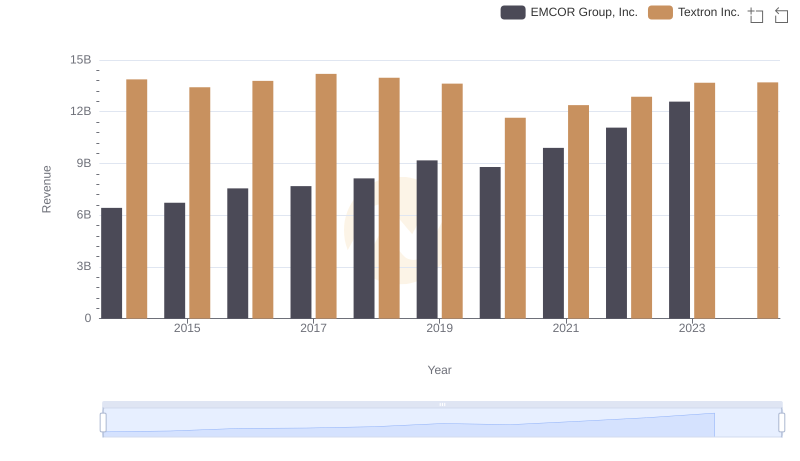
Who Generates More Revenue? EMCOR Group, Inc. or Textron Inc.
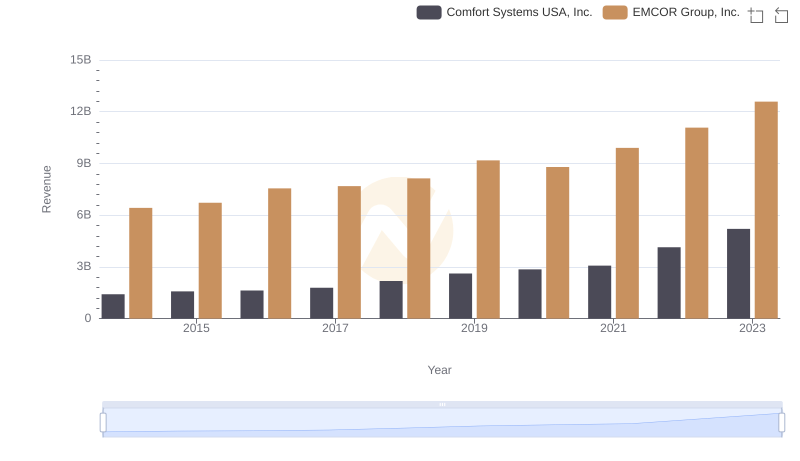
EMCOR Group, Inc. vs Comfort Systems USA, Inc.: Examining Key Revenue Metrics
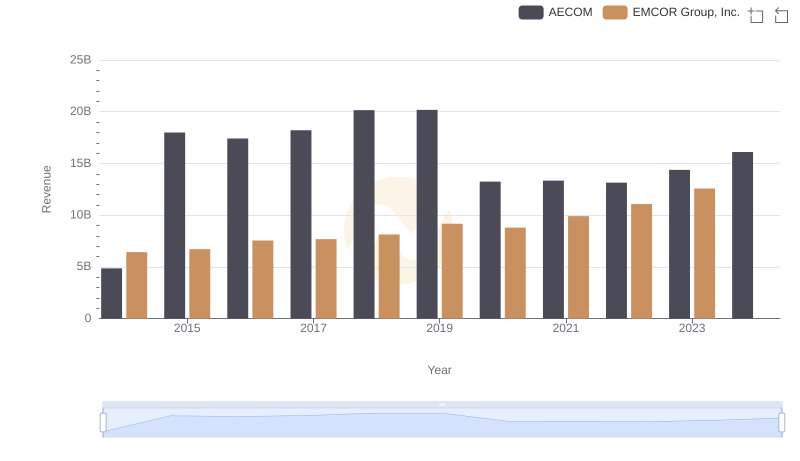
Revenue Insights: EMCOR Group, Inc. and AECOM Performance Compared
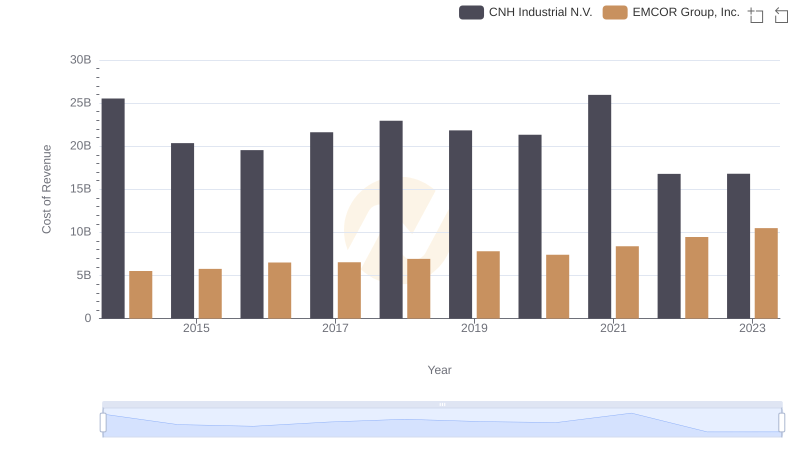
EMCOR Group, Inc. vs CNH Industrial N.V.: Efficiency in Cost of Revenue Explored
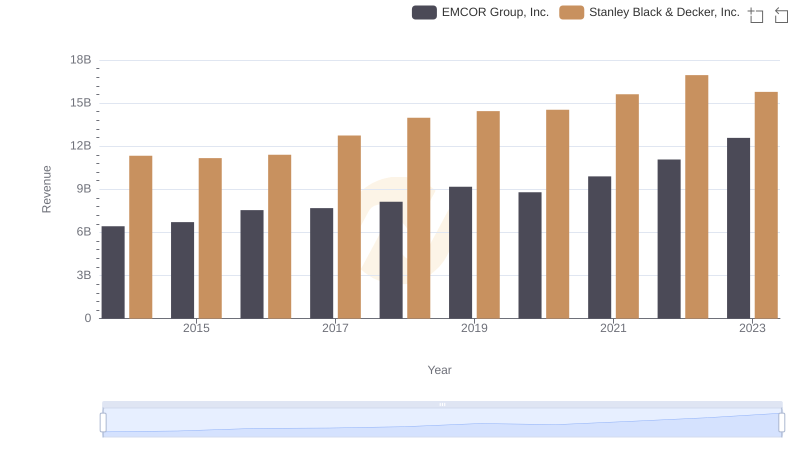
EMCOR Group, Inc. or Stanley Black & Decker, Inc.: Who Leads in Yearly Revenue?
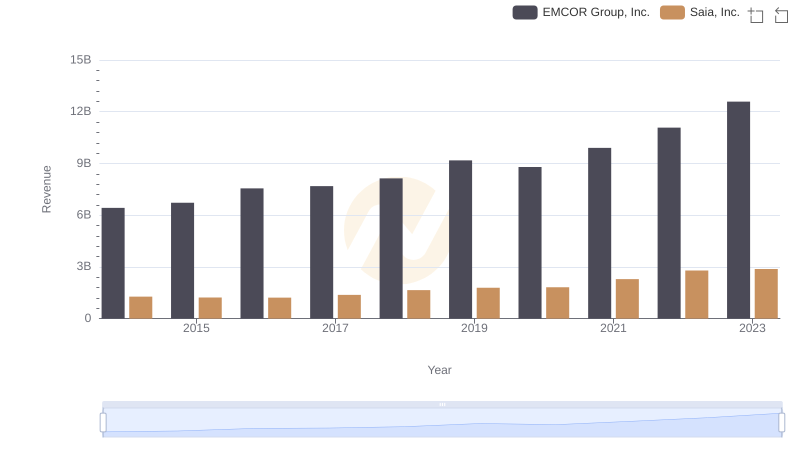
EMCOR Group, Inc. or Saia, Inc.: Who Leads in Yearly Revenue?
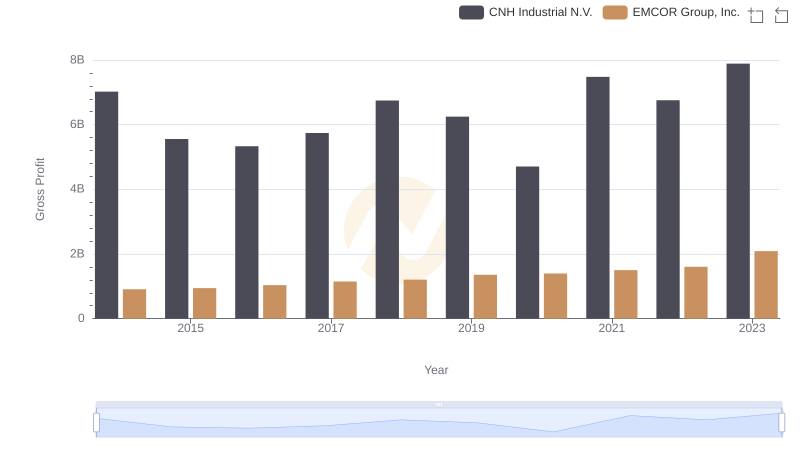
Key Insights on Gross Profit: EMCOR Group, Inc. vs CNH Industrial N.V.
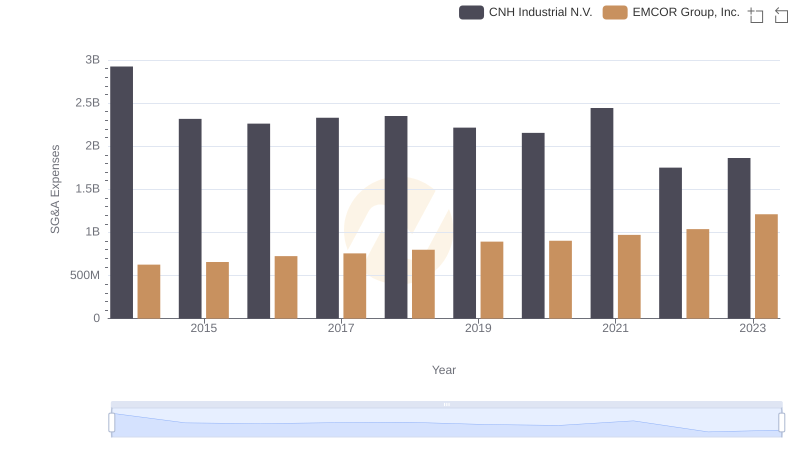
EMCOR Group, Inc. or CNH Industrial N.V.: Who Manages SG&A Costs Better?
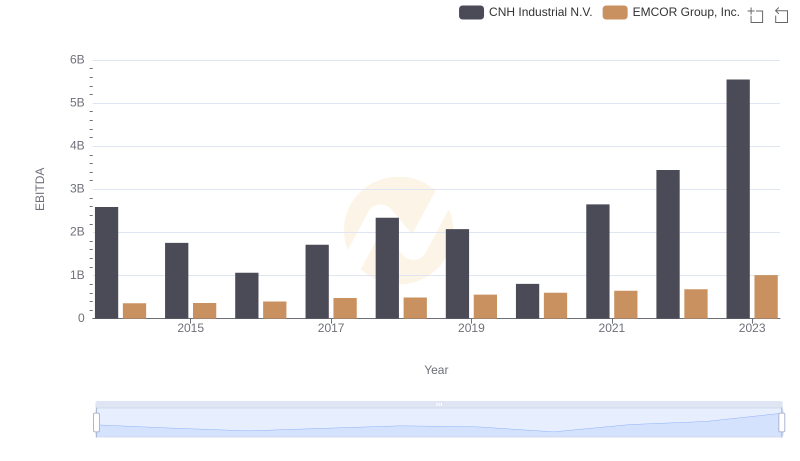
EBITDA Performance Review: EMCOR Group, Inc. vs CNH Industrial N.V.