| __timestamp | AECOM | EMCOR Group, Inc. |
|---|---|---|
| Wednesday, January 1, 2014 | 417662000 | 355858000 |
| Thursday, January 1, 2015 | 1020478000 | 362095000 |
| Friday, January 1, 2016 | 926466000 | 395913000 |
| Sunday, January 1, 2017 | 920292000 | 478459000 |
| Monday, January 1, 2018 | 680801000 | 489954000 |
| Tuesday, January 1, 2019 | 573352000 | 556055000 |
| Wednesday, January 1, 2020 | 580017000 | 601449000 |
| Friday, January 1, 2021 | 813356000 | 646861000 |
| Saturday, January 1, 2022 | 826856000 | 682399000 |
| Sunday, January 1, 2023 | 543642000 | 1009017000 |
| Monday, January 1, 2024 | 1082384000 |
Cracking the code
In the competitive landscape of engineering and construction, EMCOR Group, Inc. and AECOM have been pivotal players. Over the past decade, AECOM has consistently outperformed EMCOR in terms of EBITDA, with an average of 36% higher earnings. However, 2023 marked a turning point as EMCOR surged ahead, achieving a remarkable 81% increase from the previous year, while AECOM experienced a 34% decline.
From 2014 to 2022, AECOM maintained a steady lead, peaking in 2024 with a projected EBITDA of over 1 billion. Meanwhile, EMCOR's growth trajectory was more gradual, culminating in a significant leap in 2023. This shift underscores the dynamic nature of the industry, where strategic decisions and market conditions can rapidly alter the competitive landscape.
As we look to the future, the question remains: will EMCOR sustain its newfound momentum, or will AECOM reclaim its dominance?
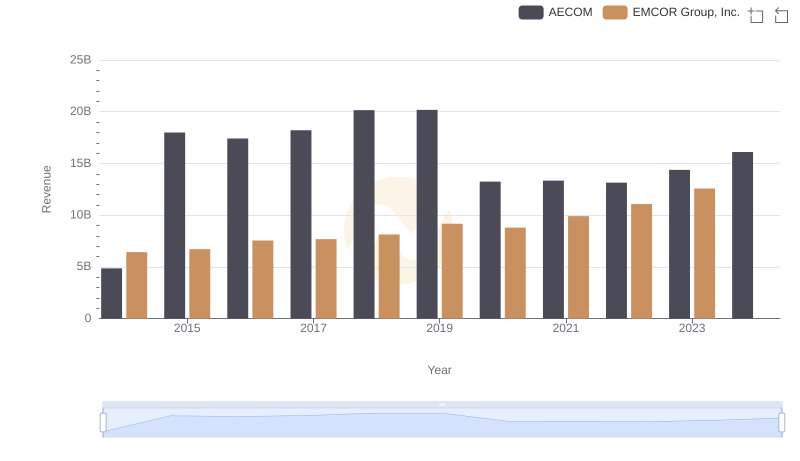
Revenue Insights: EMCOR Group, Inc. and AECOM Performance Compared
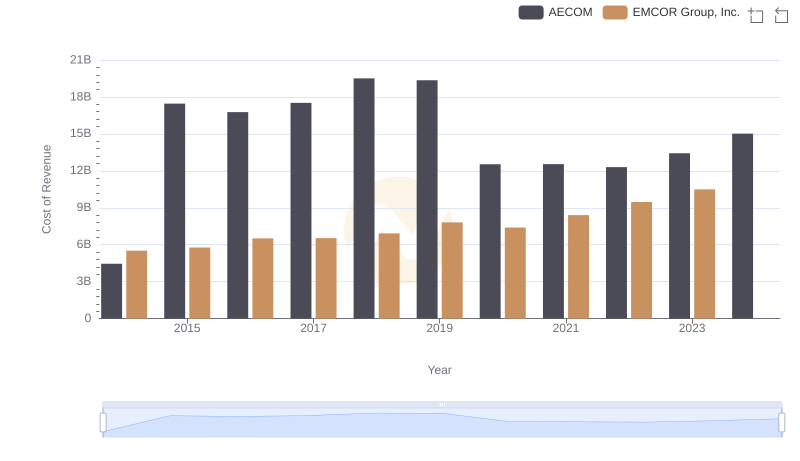
Cost of Revenue Trends: EMCOR Group, Inc. vs AECOM
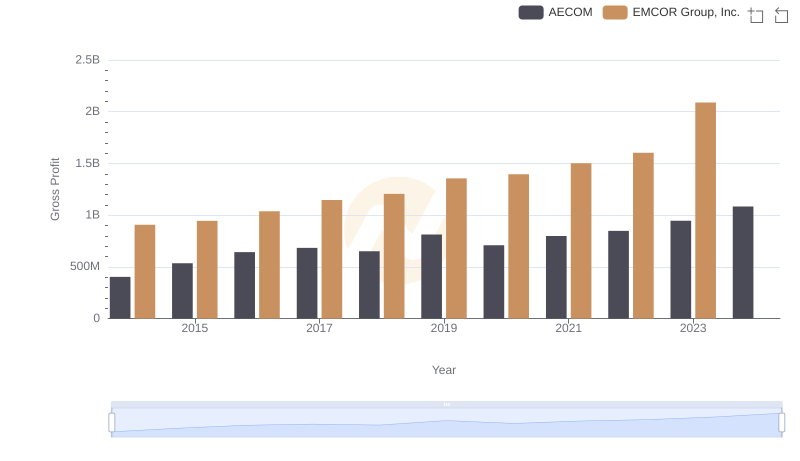
Who Generates Higher Gross Profit? EMCOR Group, Inc. or AECOM
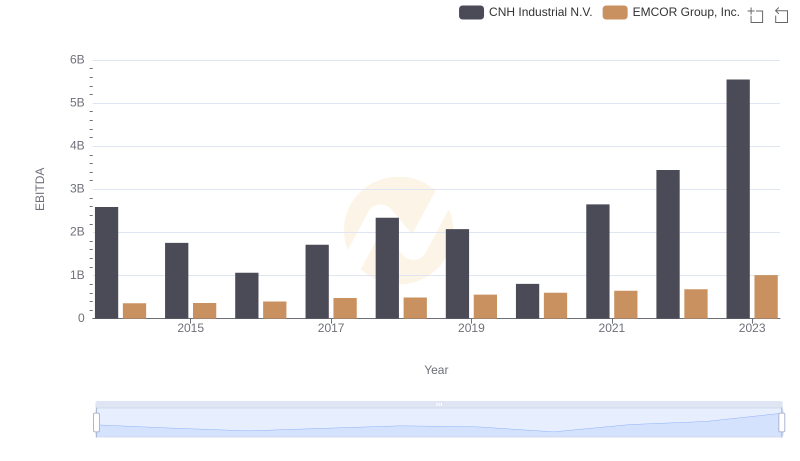
EBITDA Performance Review: EMCOR Group, Inc. vs CNH Industrial N.V.
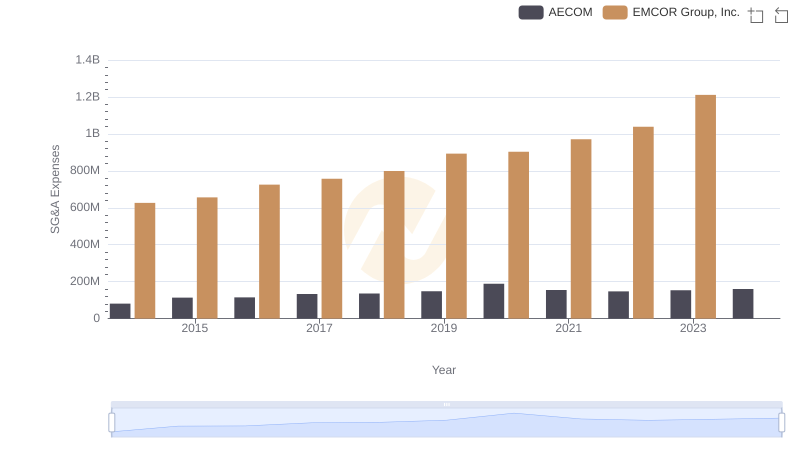
Comparing SG&A Expenses: EMCOR Group, Inc. vs AECOM Trends and Insights
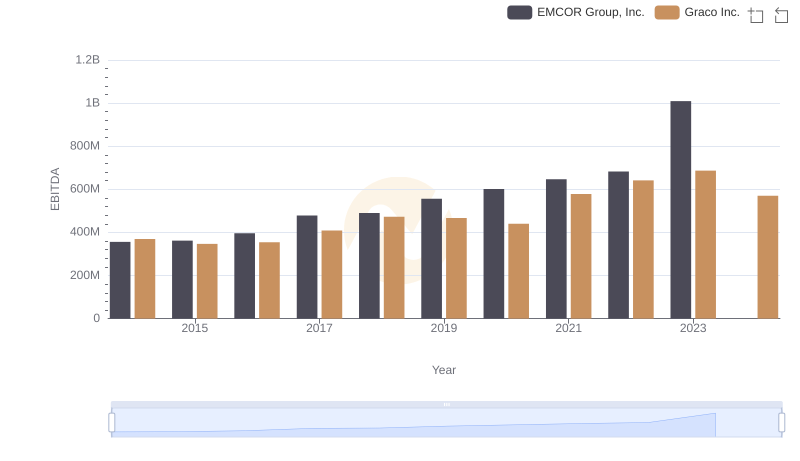
A Professional Review of EBITDA: EMCOR Group, Inc. Compared to Graco Inc.
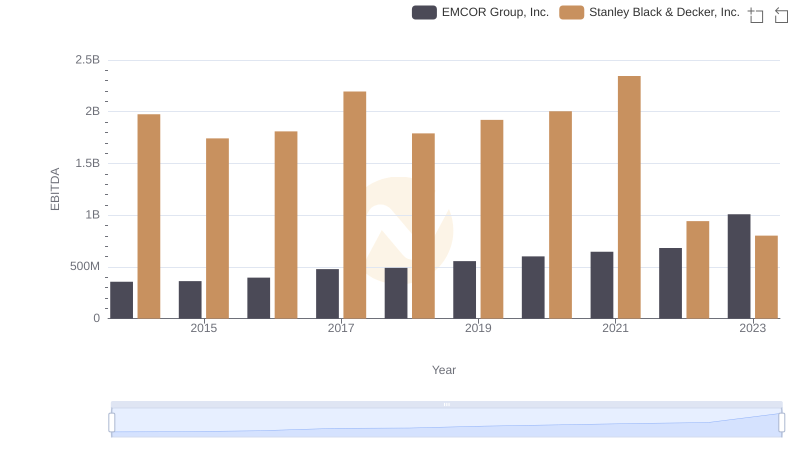
EMCOR Group, Inc. and Stanley Black & Decker, Inc.: A Detailed Examination of EBITDA Performance
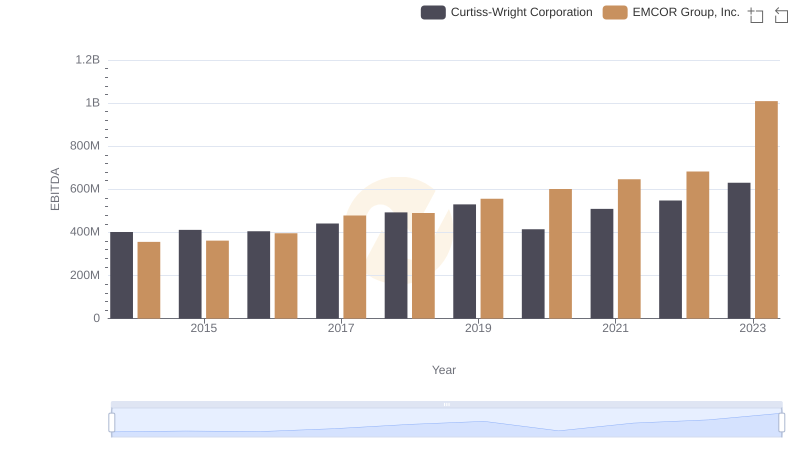
EBITDA Metrics Evaluated: EMCOR Group, Inc. vs Curtiss-Wright Corporation
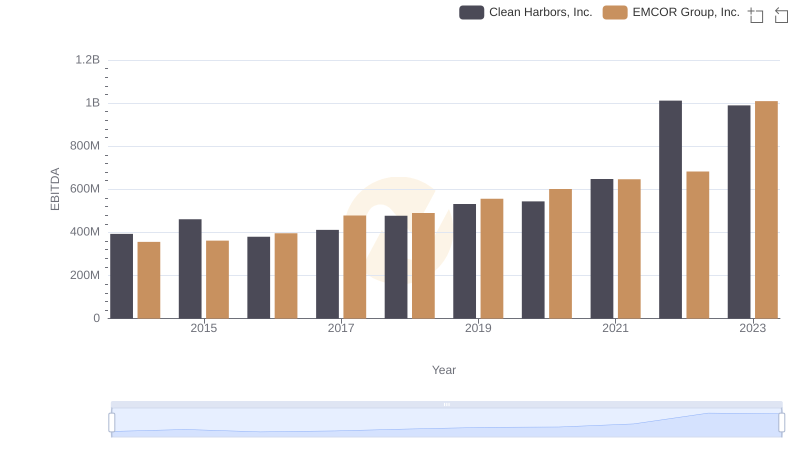
EBITDA Metrics Evaluated: EMCOR Group, Inc. vs Clean Harbors, Inc.
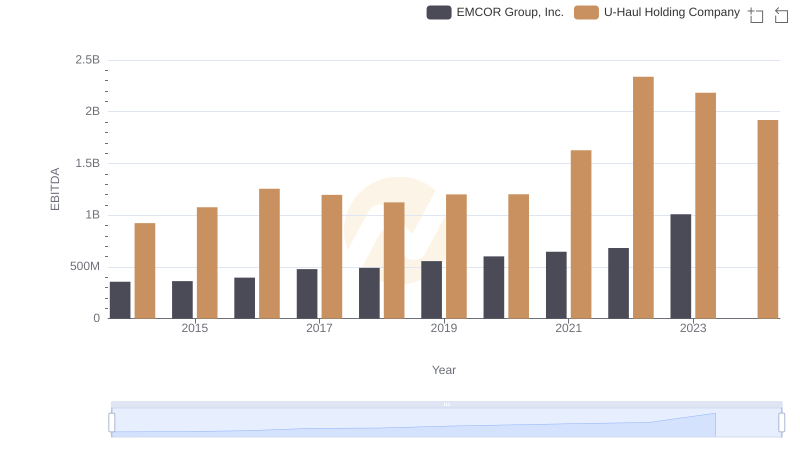
Professional EBITDA Benchmarking: EMCOR Group, Inc. vs U-Haul Holding Company