| __timestamp | Allegion plc | United Rentals, Inc. |
|---|---|---|
| Wednesday, January 1, 2014 | 365700000 | 1678000000 |
| Thursday, January 1, 2015 | 315400000 | 2653000000 |
| Friday, January 1, 2016 | 422600000 | 2566000000 |
| Sunday, January 1, 2017 | 523300000 | 2843000000 |
| Monday, January 1, 2018 | 617600000 | 3628000000 |
| Tuesday, January 1, 2019 | 614300000 | 4200000000 |
| Wednesday, January 1, 2020 | 497700000 | 2195000000 |
| Friday, January 1, 2021 | 657300000 | 2642000000 |
| Saturday, January 1, 2022 | 688300000 | 5464000000 |
| Sunday, January 1, 2023 | 819300000 | 6627000000 |
| Monday, January 1, 2024 | 919800000 | 4516000000 |
Unveiling the hidden dimensions of data
In the ever-evolving landscape of industrial giants, United Rentals, Inc. and Allegion plc have carved distinct paths over the past decade. From 2014 to 2023, United Rentals, Inc. has consistently outperformed Allegion plc in EBITDA, showcasing a robust growth trajectory. In 2023, United Rentals, Inc. achieved an EBITDA of approximately $6.6 billion, marking a staggering 294% increase from 2014. In contrast, Allegion plc, while showing steady growth, reached an EBITDA of around $819 million in 2023, reflecting a 124% rise since 2014.
The data highlights United Rentals, Inc.'s resilience and strategic prowess, especially during challenging economic periods like 2020, where it maintained a significant EBITDA despite a dip. Allegion plc, though smaller in scale, has shown commendable growth, particularly in recent years. This comparison underscores the dynamic nature of the industrial sector and the varying strategies companies employ to thrive.

United Rentals, Inc. vs Allegion plc: Examining Key Revenue Metrics
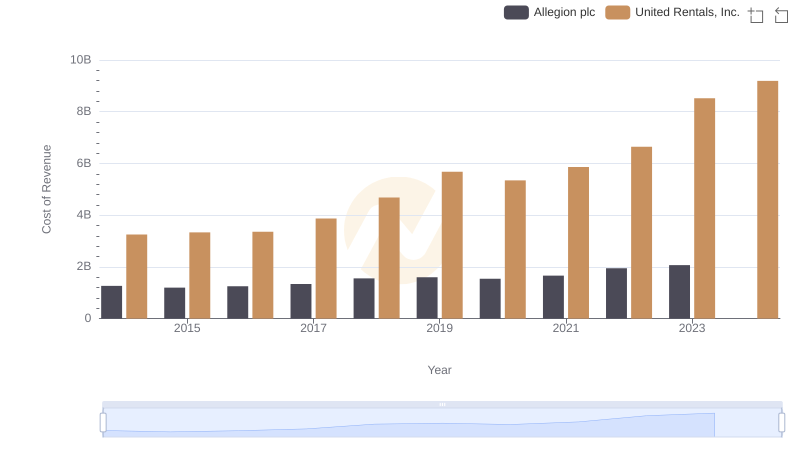
Cost of Revenue: Key Insights for United Rentals, Inc. and Allegion plc
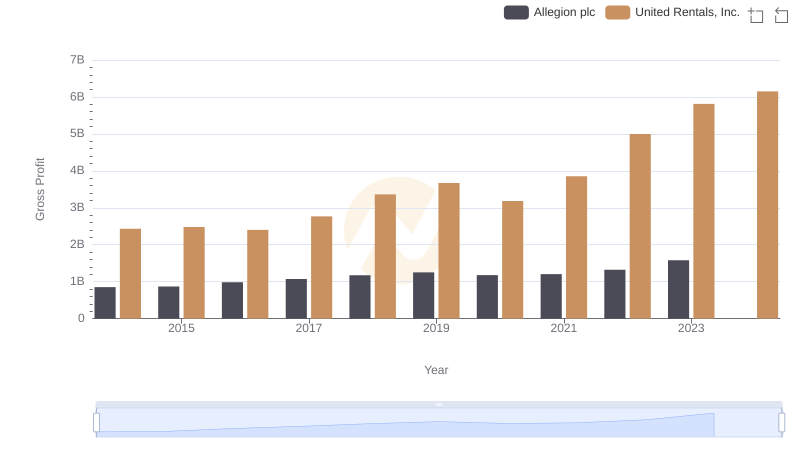
Gross Profit Comparison: United Rentals, Inc. and Allegion plc Trends
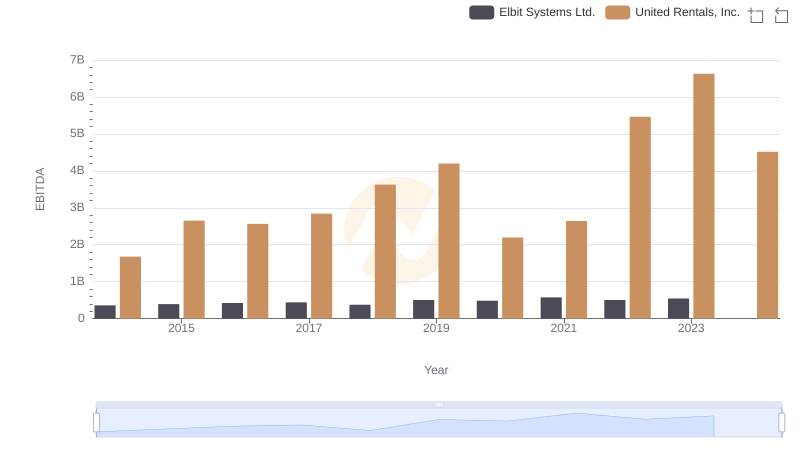
A Side-by-Side Analysis of EBITDA: United Rentals, Inc. and Elbit Systems Ltd.
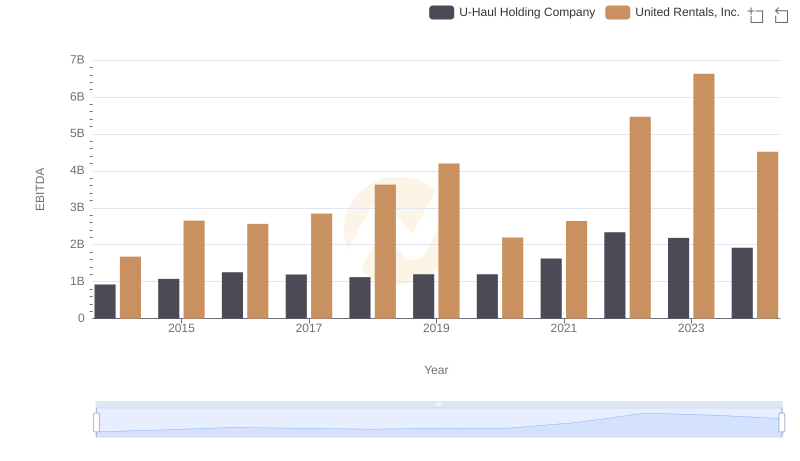
EBITDA Metrics Evaluated: United Rentals, Inc. vs U-Haul Holding Company
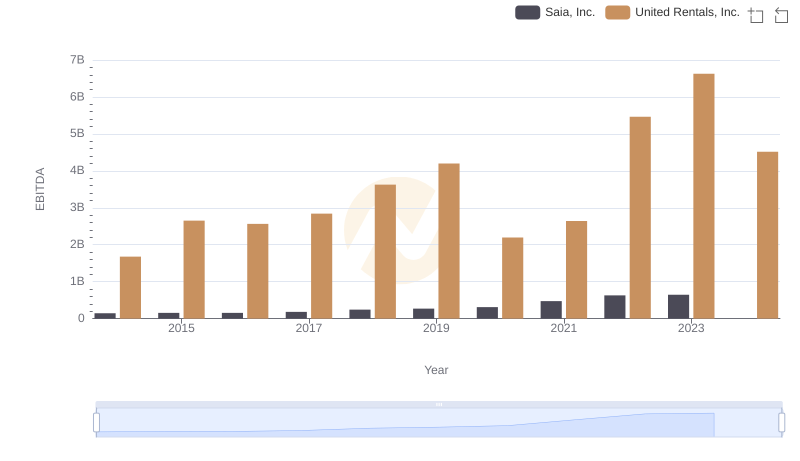
United Rentals, Inc. vs Saia, Inc.: In-Depth EBITDA Performance Comparison
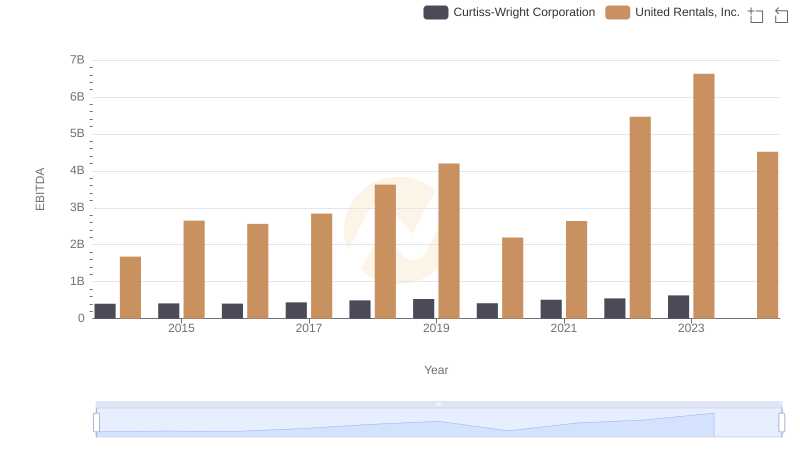
Comparative EBITDA Analysis: United Rentals, Inc. vs Curtiss-Wright Corporation
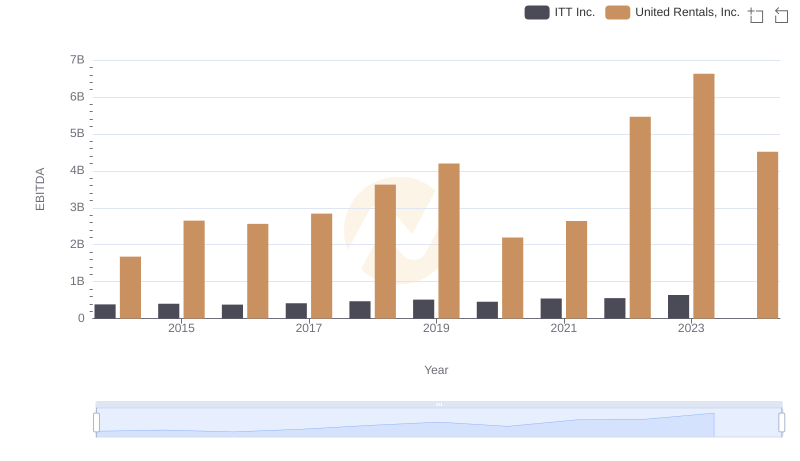
Comprehensive EBITDA Comparison: United Rentals, Inc. vs ITT Inc.
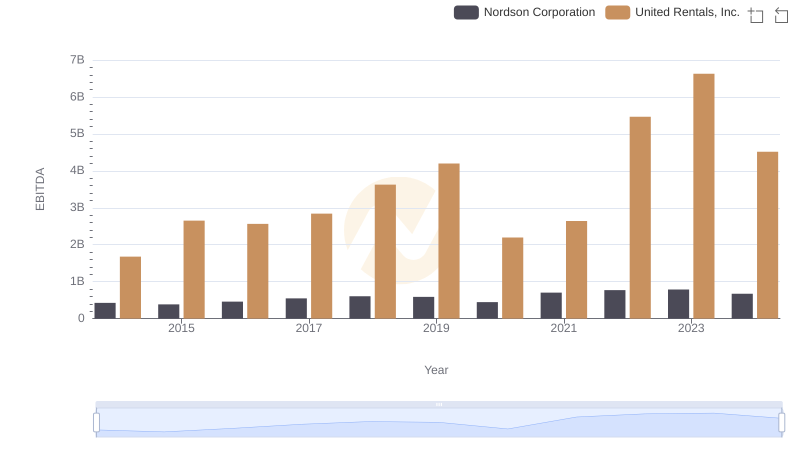
Comprehensive EBITDA Comparison: United Rentals, Inc. vs Nordson Corporation
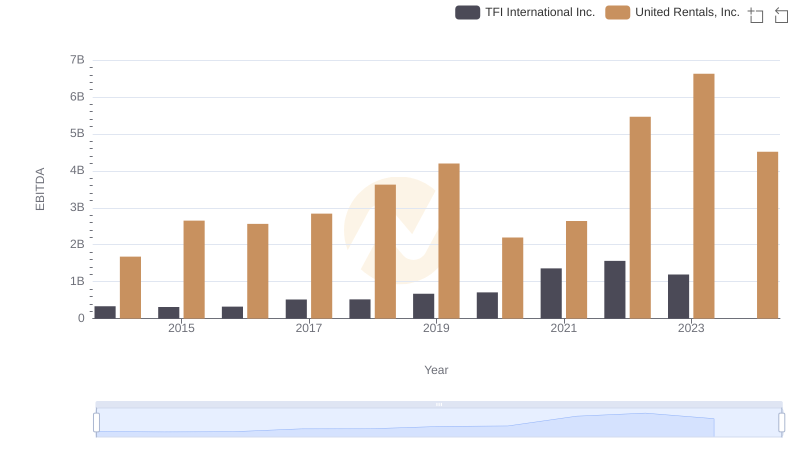
A Professional Review of EBITDA: United Rentals, Inc. Compared to TFI International Inc.
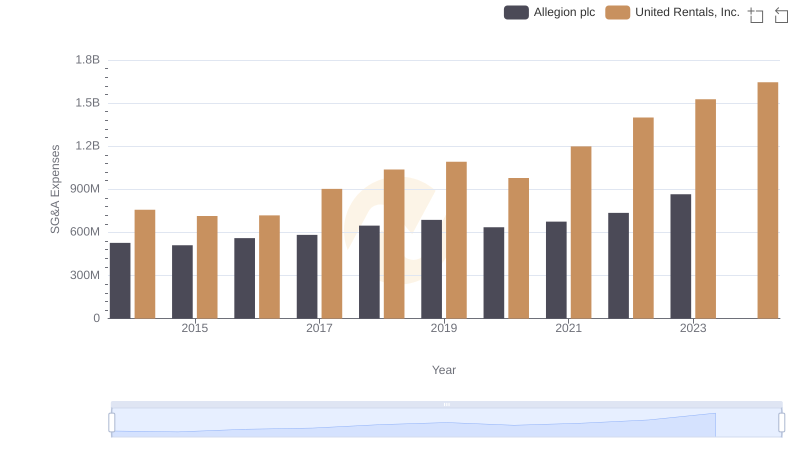
United Rentals, Inc. vs Allegion plc: SG&A Expense Trends
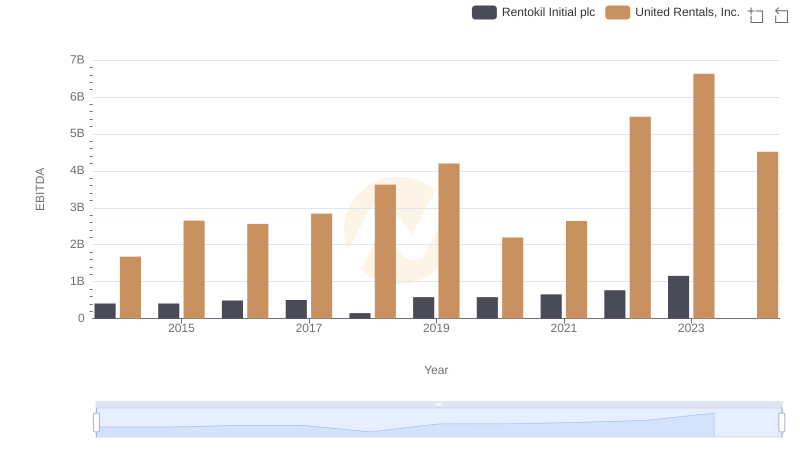
Comparative EBITDA Analysis: United Rentals, Inc. vs Rentokil Initial plc