| __timestamp | Elbit Systems Ltd. | United Rentals, Inc. |
|---|---|---|
| Wednesday, January 1, 2014 | 358274000 | 1678000000 |
| Thursday, January 1, 2015 | 390932000 | 2653000000 |
| Friday, January 1, 2016 | 424003291 | 2566000000 |
| Sunday, January 1, 2017 | 438616108 | 2843000000 |
| Monday, January 1, 2018 | 374866620 | 3628000000 |
| Tuesday, January 1, 2019 | 502866000 | 4200000000 |
| Wednesday, January 1, 2020 | 484464000 | 2195000000 |
| Friday, January 1, 2021 | 576645646 | 2642000000 |
| Saturday, January 1, 2022 | 505269000 | 5464000000 |
| Sunday, January 1, 2023 | 544811000 | 6627000000 |
| Monday, January 1, 2024 | 4516000000 |
Unveiling the hidden dimensions of data
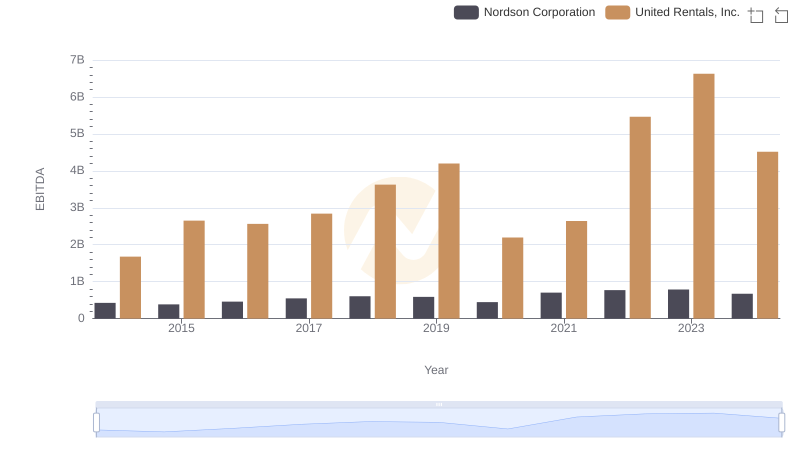
In the ever-evolving landscape of global business, understanding the financial health of companies is crucial. This analysis delves into the EBITDA performance of United Rentals, Inc. and Elbit Systems Ltd. from 2014 to 2023. United Rentals, a leader in equipment rental, has shown a remarkable growth trajectory, with EBITDA increasing by nearly 295% over the decade, peaking at approximately $6.6 billion in 2023. In contrast, Elbit Systems, a defense electronics company, experienced a more modest growth of around 52%, reaching its highest EBITDA of about $577 million in 2021. The data highlights the resilience and strategic prowess of United Rentals in navigating market challenges, while Elbit Systems maintains steady growth in a competitive industry. Notably, the data for 2024 is incomplete, indicating potential shifts in the financial landscape.
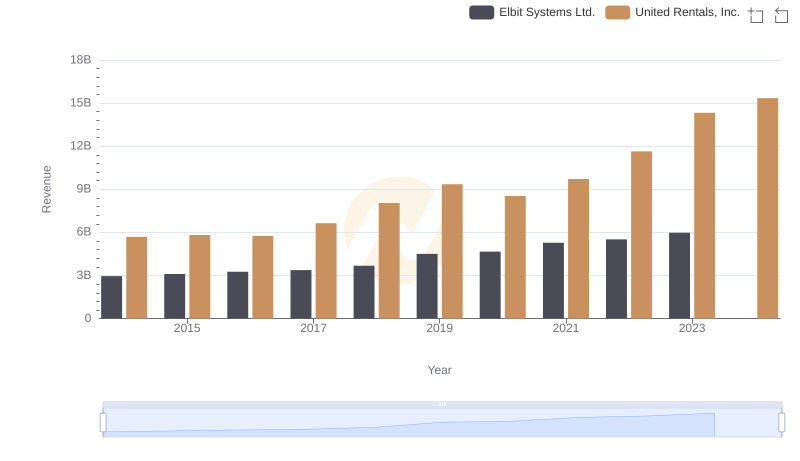
Breaking Down Revenue Trends: United Rentals, Inc. vs Elbit Systems Ltd.
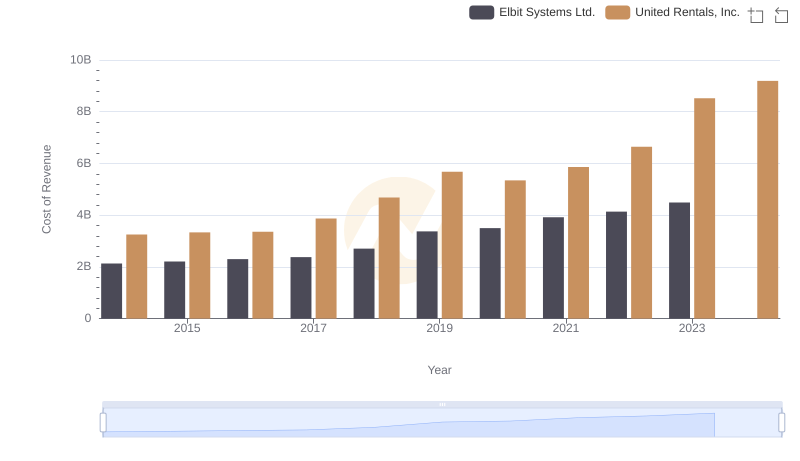
Comparing Cost of Revenue Efficiency: United Rentals, Inc. vs Elbit Systems Ltd.
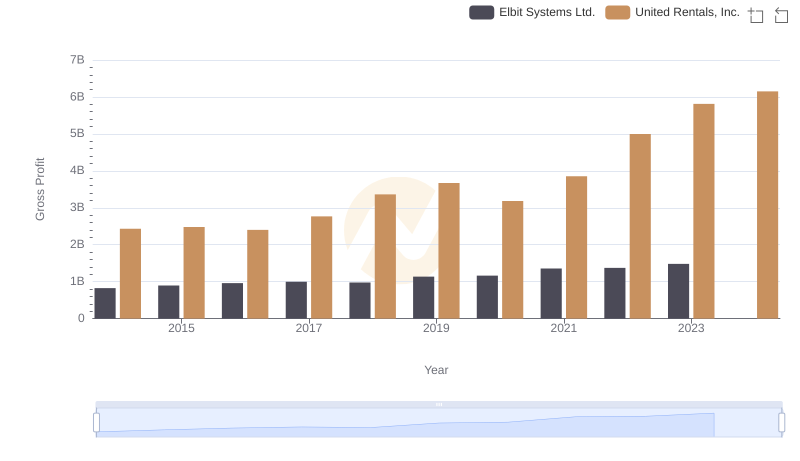
Gross Profit Analysis: Comparing United Rentals, Inc. and Elbit Systems Ltd.
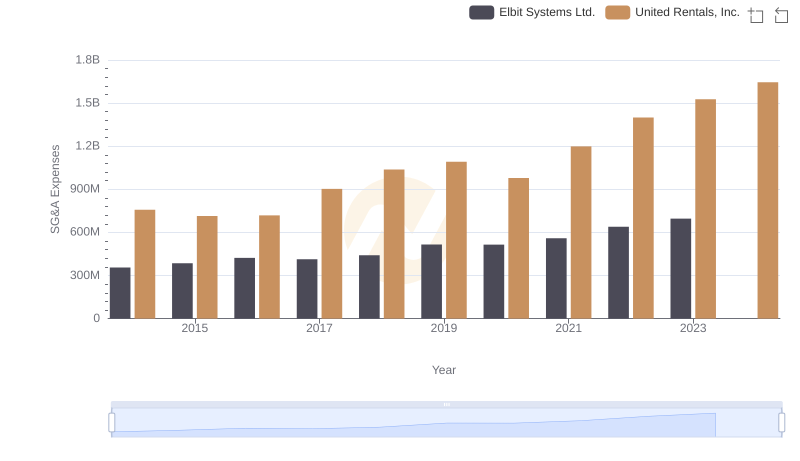
Operational Costs Compared: SG&A Analysis of United Rentals, Inc. and Elbit Systems Ltd.

Comprehensive EBITDA Comparison: United Rentals, Inc. vs Stanley Black & Decker, Inc.
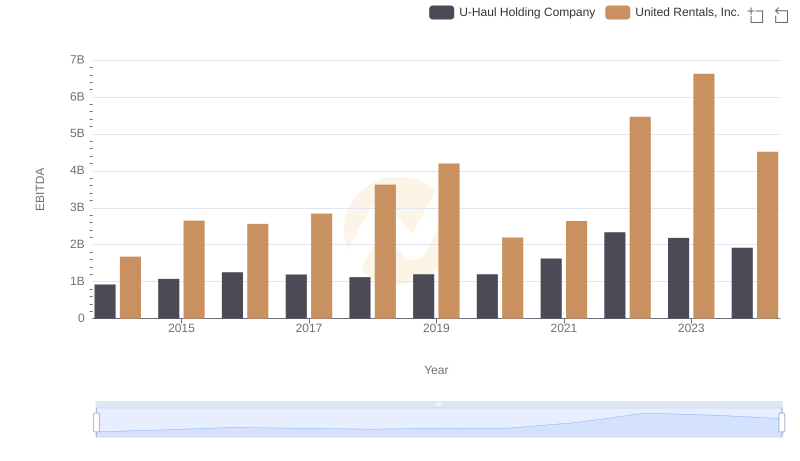
EBITDA Metrics Evaluated: United Rentals, Inc. vs U-Haul Holding Company
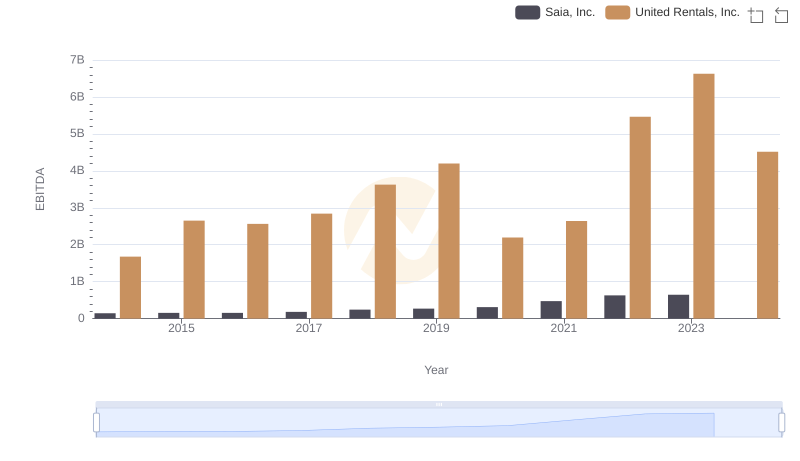
United Rentals, Inc. vs Saia, Inc.: In-Depth EBITDA Performance Comparison
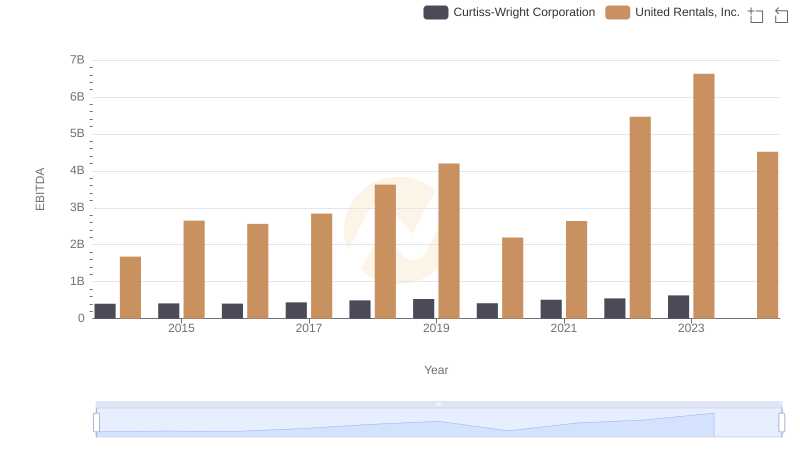
Comparative EBITDA Analysis: United Rentals, Inc. vs Curtiss-Wright Corporation
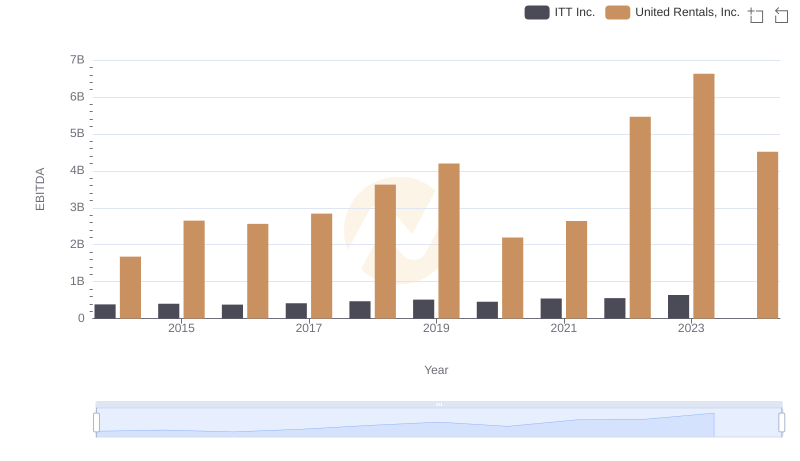
Comprehensive EBITDA Comparison: United Rentals, Inc. vs ITT Inc.
Comprehensive EBITDA Comparison: United Rentals, Inc. vs Nordson Corporation