| __timestamp | Allegion plc | United Rentals, Inc. |
|---|---|---|
| Wednesday, January 1, 2014 | 1264600000 | 3253000000 |
| Thursday, January 1, 2015 | 1199000000 | 3337000000 |
| Friday, January 1, 2016 | 1252700000 | 3359000000 |
| Sunday, January 1, 2017 | 1337500000 | 3872000000 |
| Monday, January 1, 2018 | 1558400000 | 4683000000 |
| Tuesday, January 1, 2019 | 1601700000 | 5681000000 |
| Wednesday, January 1, 2020 | 1541100000 | 5347000000 |
| Friday, January 1, 2021 | 1662500000 | 5863000000 |
| Saturday, January 1, 2022 | 1949500000 | 6646000000 |
| Sunday, January 1, 2023 | 2069300000 | 8519000000 |
| Monday, January 1, 2024 | 2103700000 | 9195000000 |
Unveiling the hidden dimensions of data
In the dynamic world of industrial services and security solutions, understanding cost structures is crucial. United Rentals, Inc. and Allegion plc, two giants in their respective fields, have shown distinct trends in their cost of revenue from 2014 to 2023. United Rentals, Inc. has seen a staggering 162% increase in its cost of revenue, peaking at approximately $8.5 billion in 2023. This reflects their aggressive expansion and market penetration strategies. In contrast, Allegion plc's cost of revenue grew by about 65%, reaching around $2.1 billion in 2023, indicating steady growth in the security solutions market. Notably, data for Allegion plc in 2024 is missing, suggesting a need for updated insights. These trends highlight the differing operational scales and market strategies of these industry leaders, offering valuable insights for investors and analysts alike.
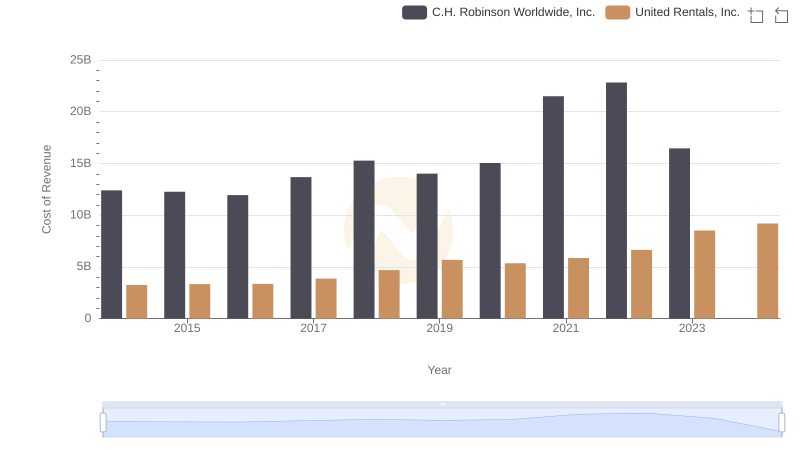
United Rentals, Inc. vs C.H. Robinson Worldwide, Inc.: Efficiency in Cost of Revenue Explored
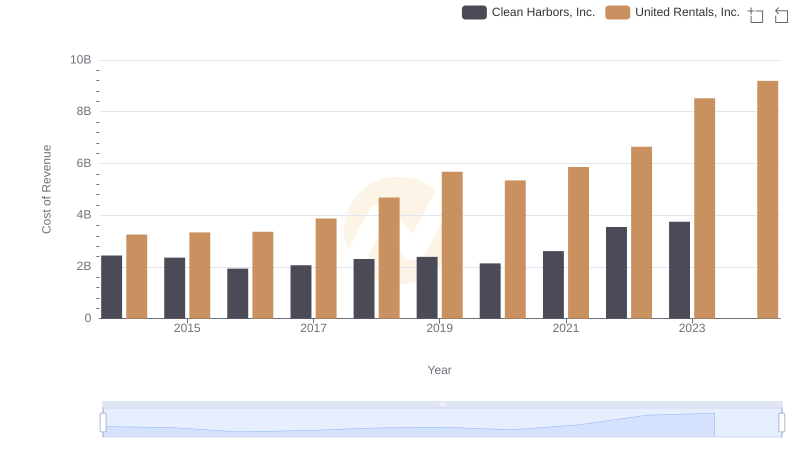
Cost of Revenue: Key Insights for United Rentals, Inc. and Clean Harbors, Inc.
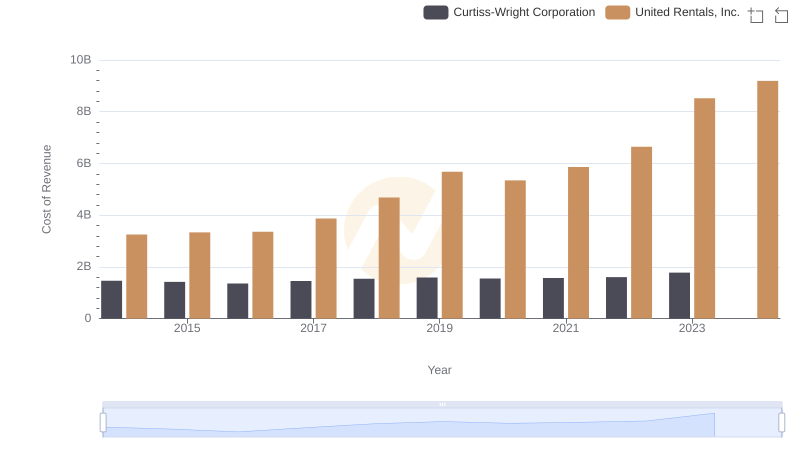
Cost of Revenue Trends: United Rentals, Inc. vs Curtiss-Wright Corporation
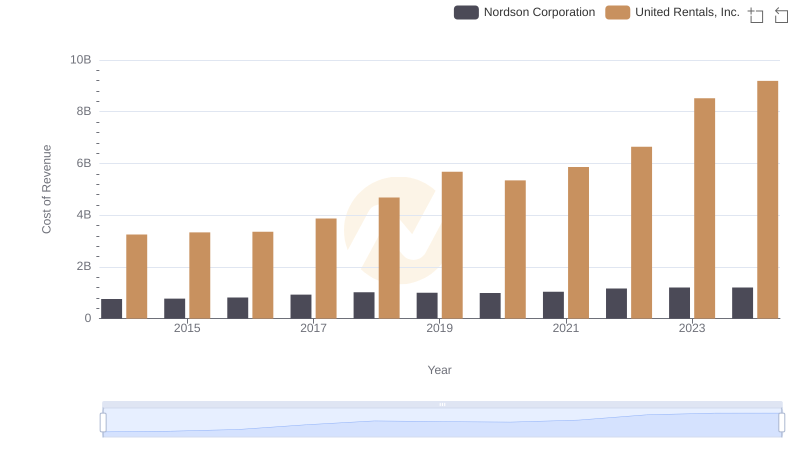
Comparing Cost of Revenue Efficiency: United Rentals, Inc. vs Nordson Corporation

United Rentals, Inc. vs Allegion plc: Examining Key Revenue Metrics
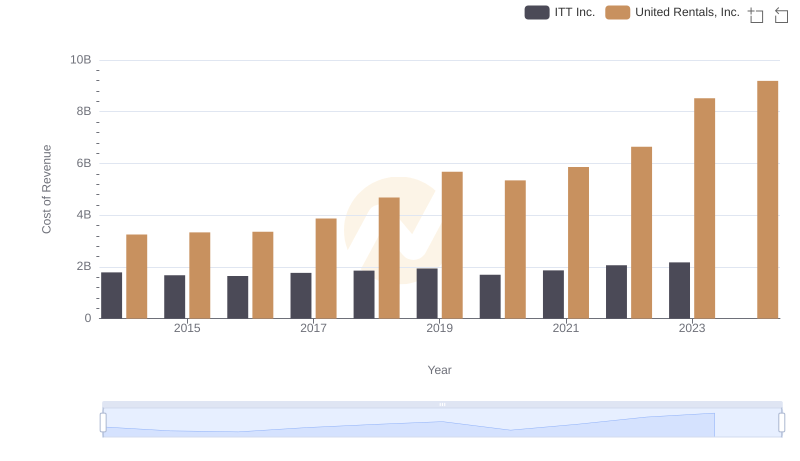
Cost of Revenue Comparison: United Rentals, Inc. vs ITT Inc.
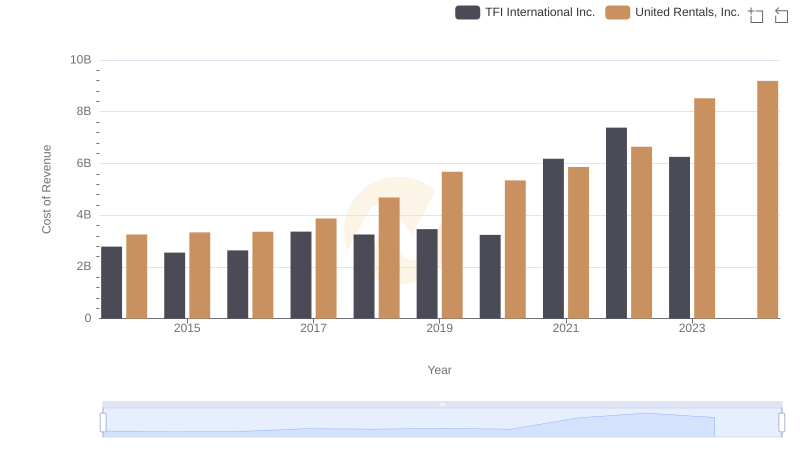
Cost Insights: Breaking Down United Rentals, Inc. and TFI International Inc.'s Expenses
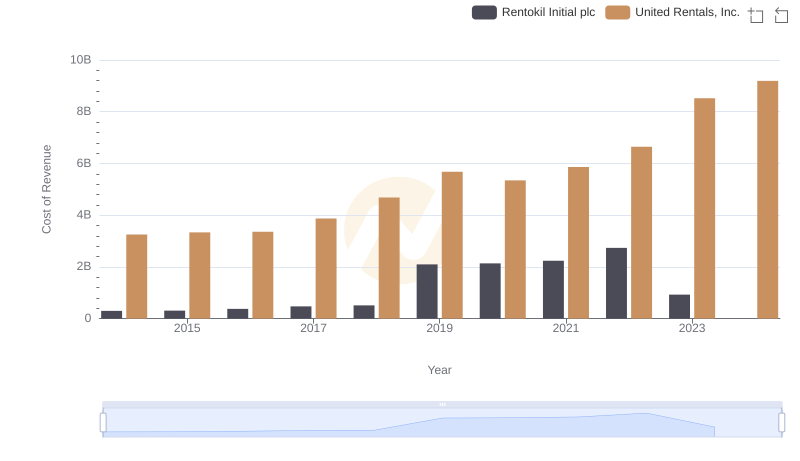
Cost of Revenue: Key Insights for United Rentals, Inc. and Rentokil Initial plc
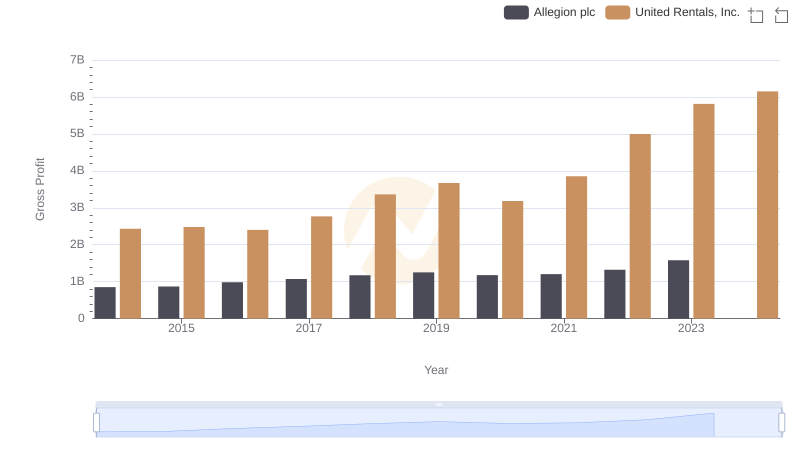
Gross Profit Comparison: United Rentals, Inc. and Allegion plc Trends
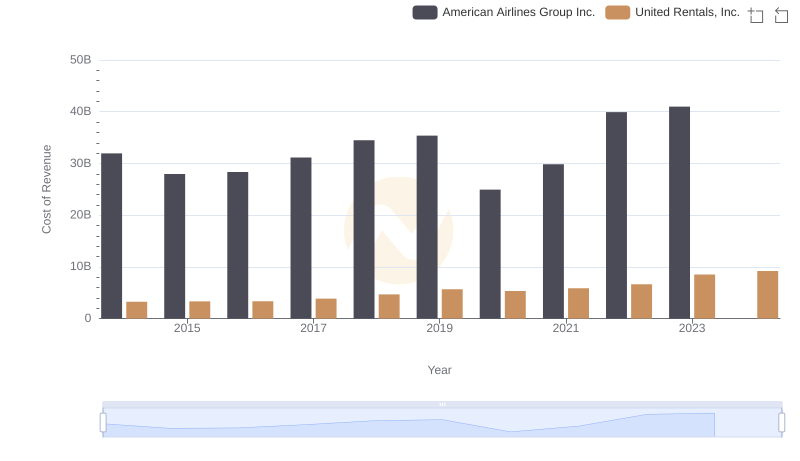
Cost of Revenue Trends: United Rentals, Inc. vs American Airlines Group Inc.
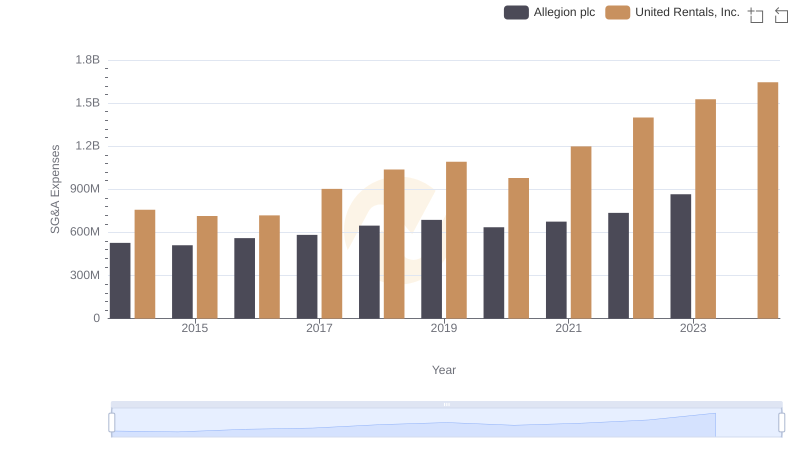
United Rentals, Inc. vs Allegion plc: SG&A Expense Trends

EBITDA Metrics Evaluated: United Rentals, Inc. vs Allegion plc