| __timestamp | Allegion plc | United Rentals, Inc. |
|---|---|---|
| Wednesday, January 1, 2014 | 527400000 | 758000000 |
| Thursday, January 1, 2015 | 510500000 | 714000000 |
| Friday, January 1, 2016 | 559800000 | 719000000 |
| Sunday, January 1, 2017 | 582500000 | 903000000 |
| Monday, January 1, 2018 | 647500000 | 1038000000 |
| Tuesday, January 1, 2019 | 687200000 | 1092000000 |
| Wednesday, January 1, 2020 | 635700000 | 979000000 |
| Friday, January 1, 2021 | 674700000 | 1199000000 |
| Saturday, January 1, 2022 | 736000000 | 1400000000 |
| Sunday, January 1, 2023 | 865600000 | 1527000000 |
| Monday, January 1, 2024 | 887800000 | 1645000000 |
Cracking the code
In the competitive landscape of corporate America, understanding the financial health of companies is crucial. This analysis delves into the Selling, General, and Administrative (SG&A) expenses of two industry giants: United Rentals, Inc. and Allegion plc, from 2014 to 2023.
United Rentals, Inc. has shown a robust upward trend in SG&A expenses, increasing by approximately 101% over the decade, peaking at 1.53 billion in 2023. This growth reflects the company's aggressive expansion and operational scaling. In contrast, Allegion plc's SG&A expenses have grown by about 64%, reaching 866 million in 2023, indicating a more conservative growth strategy.
While 2024 data for Allegion plc is unavailable, United Rentals, Inc. projects further growth. This analysis provides a window into the strategic financial maneuvers of these corporations, offering valuable insights for investors and industry analysts.

United Rentals, Inc. vs Allegion plc: Examining Key Revenue Metrics
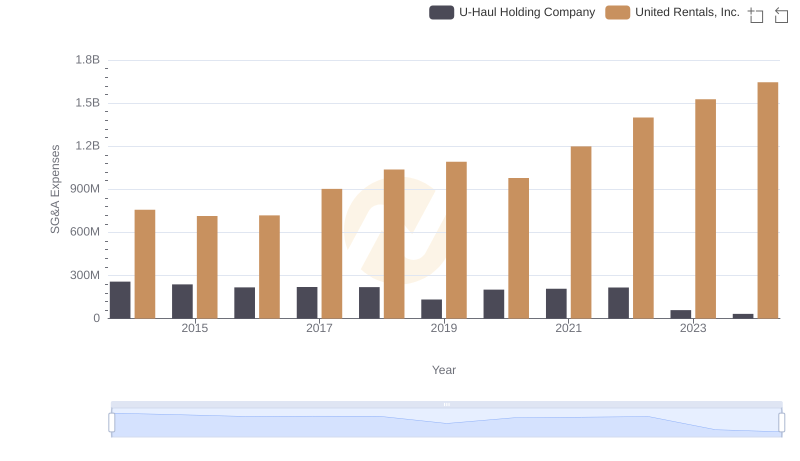
Comparing SG&A Expenses: United Rentals, Inc. vs U-Haul Holding Company Trends and Insights
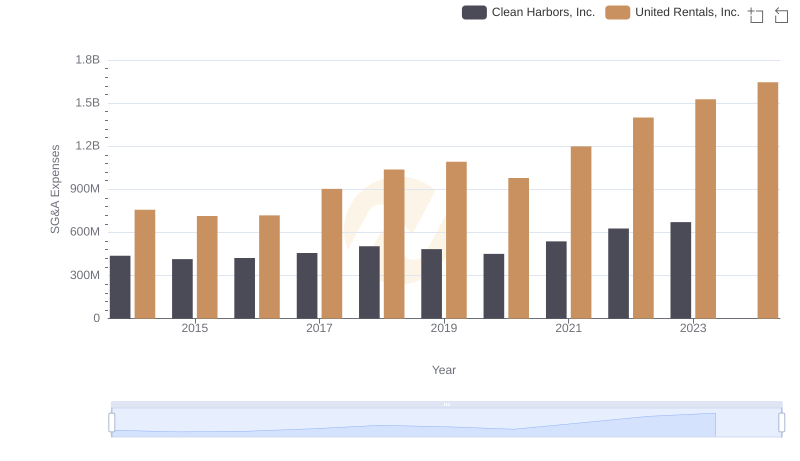
Operational Costs Compared: SG&A Analysis of United Rentals, Inc. and Clean Harbors, Inc.
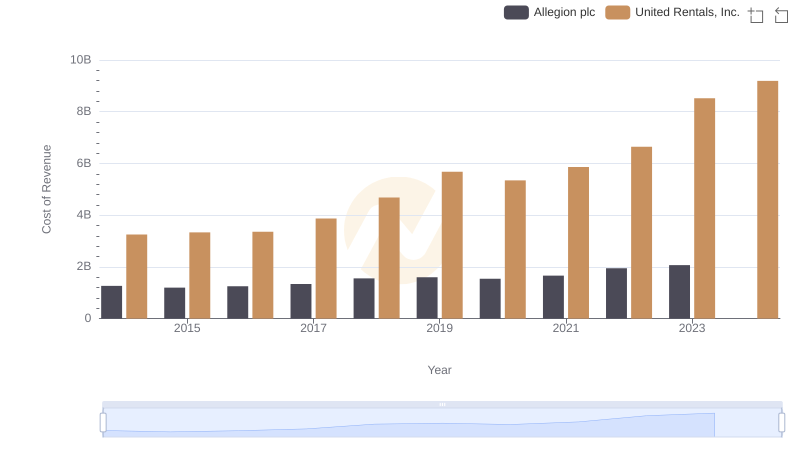
Cost of Revenue: Key Insights for United Rentals, Inc. and Allegion plc
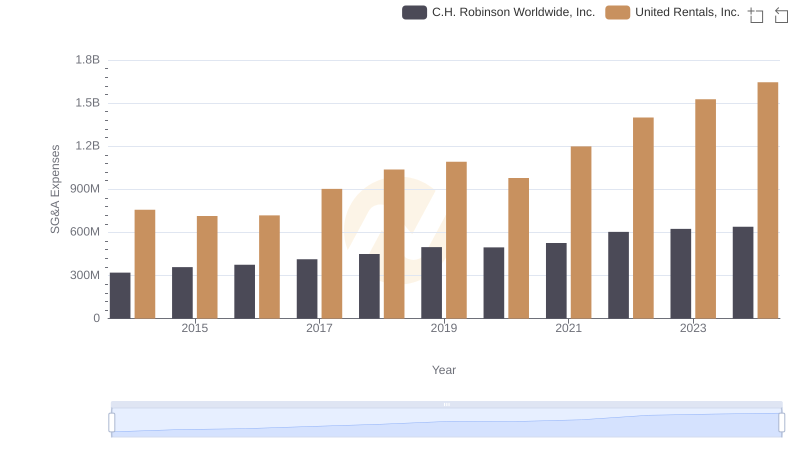
United Rentals, Inc. and C.H. Robinson Worldwide, Inc.: SG&A Spending Patterns Compared

Comparing SG&A Expenses: United Rentals, Inc. vs Curtiss-Wright Corporation Trends and Insights
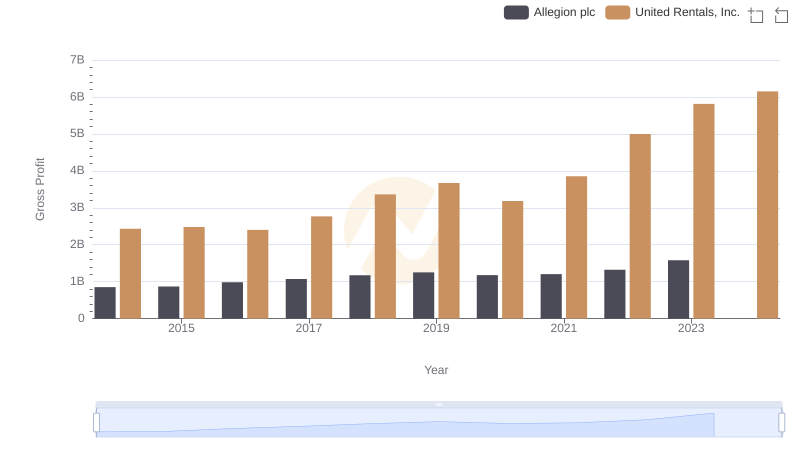
Gross Profit Comparison: United Rentals, Inc. and Allegion plc Trends
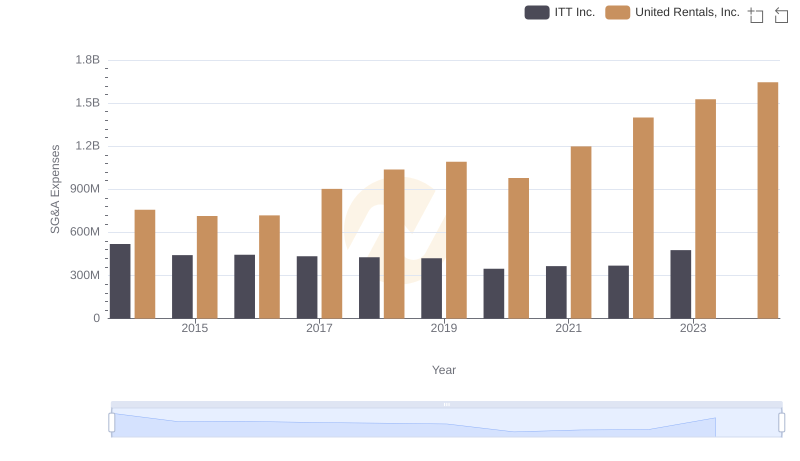
SG&A Efficiency Analysis: Comparing United Rentals, Inc. and ITT Inc.
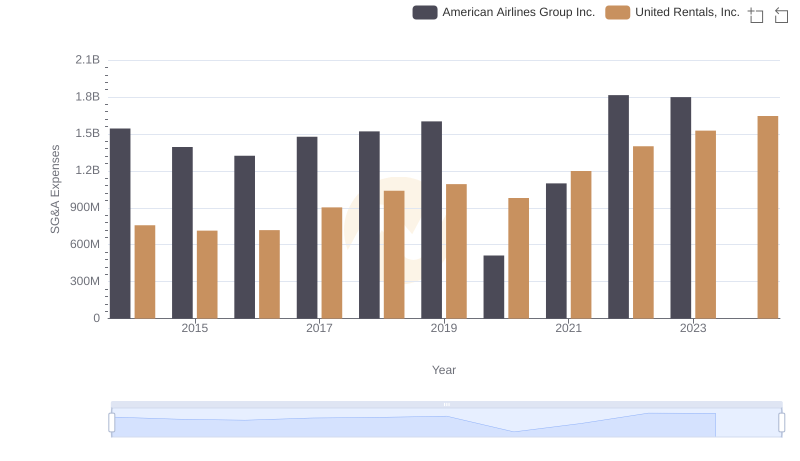
Selling, General, and Administrative Costs: United Rentals, Inc. vs American Airlines Group Inc.
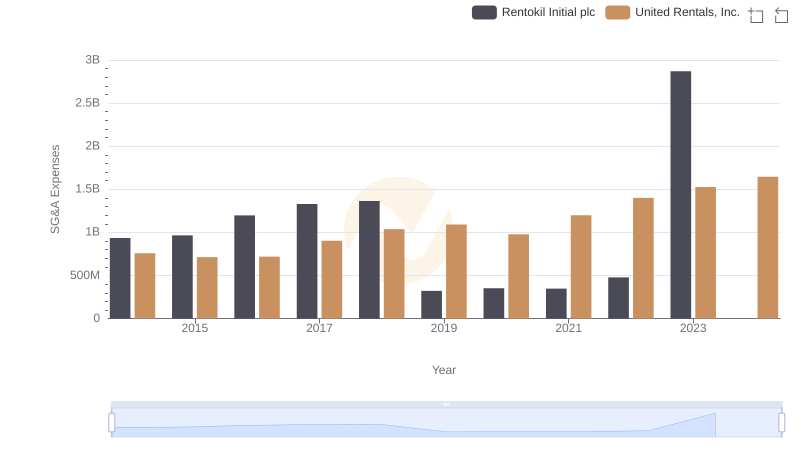
United Rentals, Inc. or Rentokil Initial plc: Who Manages SG&A Costs Better?

EBITDA Metrics Evaluated: United Rentals, Inc. vs Allegion plc