| __timestamp | Allegion plc | United Rentals, Inc. |
|---|---|---|
| Wednesday, January 1, 2014 | 853700000 | 2432000000 |
| Thursday, January 1, 2015 | 869100000 | 2480000000 |
| Friday, January 1, 2016 | 985300000 | 2403000000 |
| Sunday, January 1, 2017 | 1070700000 | 2769000000 |
| Monday, January 1, 2018 | 1173300000 | 3364000000 |
| Tuesday, January 1, 2019 | 1252300000 | 3670000000 |
| Wednesday, January 1, 2020 | 1178800000 | 3183000000 |
| Friday, January 1, 2021 | 1204900000 | 3853000000 |
| Saturday, January 1, 2022 | 1322400000 | 4996000000 |
| Sunday, January 1, 2023 | 1581500000 | 5813000000 |
| Monday, January 1, 2024 | 1668500000 | 6150000000 |
Cracking the code
In the ever-evolving landscape of industrial and security solutions, United Rentals, Inc. and Allegion plc have showcased intriguing financial trajectories over the past decade. From 2014 to 2023, United Rentals, Inc. has consistently outperformed Allegion plc in terms of gross profit, with a remarkable growth of approximately 139% from 2014 to 2023. Allegion plc, while maintaining steady growth, saw its gross profit increase by about 85% during the same period.
These trends highlight the dynamic nature of the industry and the strategic maneuvers by these companies to capture market share.
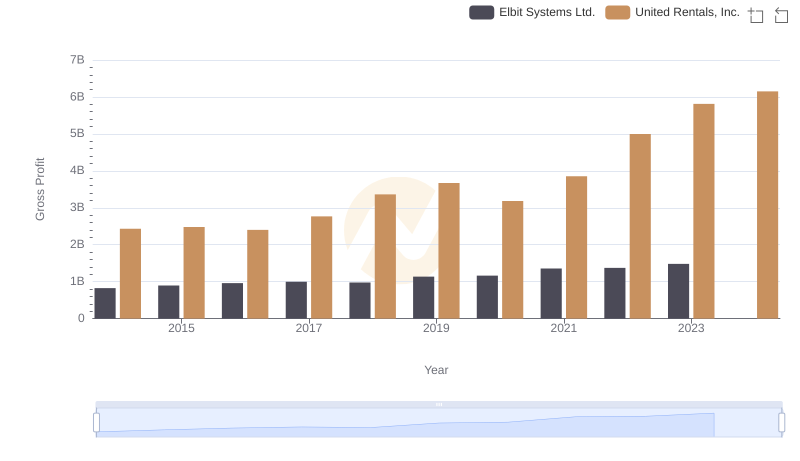
Gross Profit Analysis: Comparing United Rentals, Inc. and Elbit Systems Ltd.

United Rentals, Inc. vs Allegion plc: Examining Key Revenue Metrics

Gross Profit Trends Compared: United Rentals, Inc. vs C.H. Robinson Worldwide, Inc.
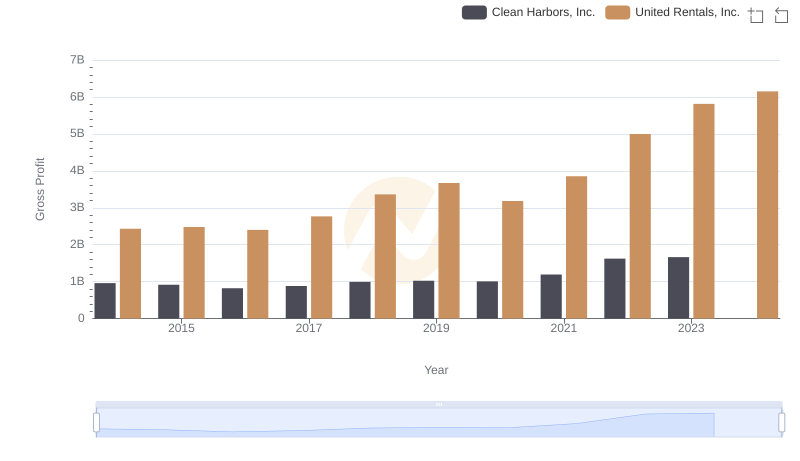
United Rentals, Inc. and Clean Harbors, Inc.: A Detailed Gross Profit Analysis
United Rentals, Inc. and Curtiss-Wright Corporation: A Detailed Gross Profit Analysis
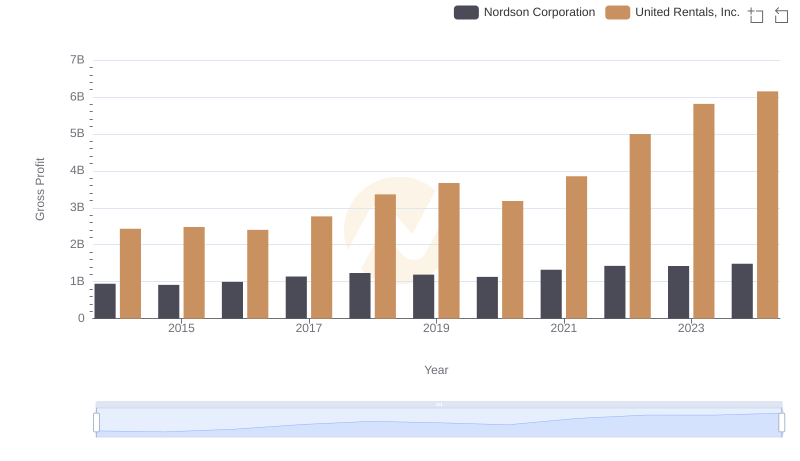
United Rentals, Inc. and Nordson Corporation: A Detailed Gross Profit Analysis
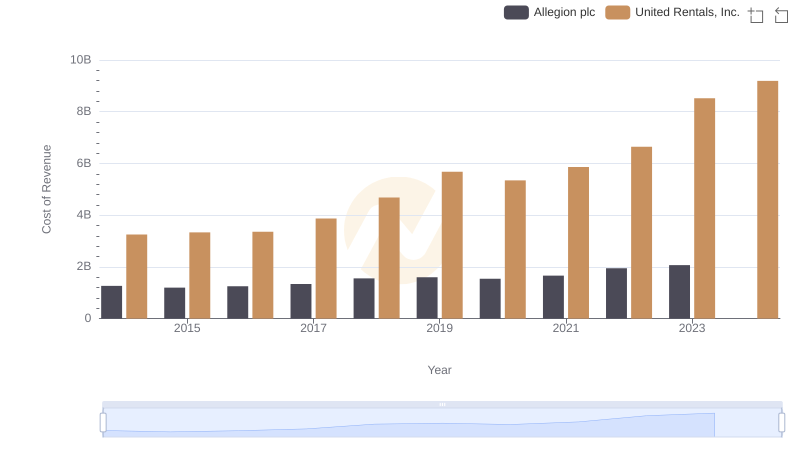
Cost of Revenue: Key Insights for United Rentals, Inc. and Allegion plc
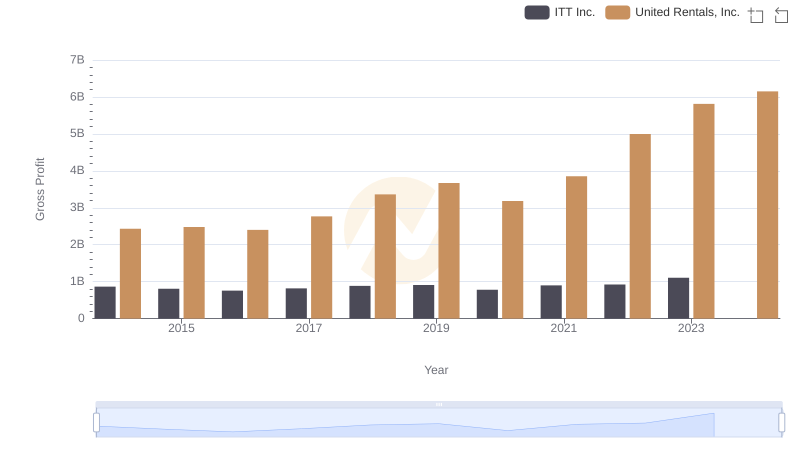
Who Generates Higher Gross Profit? United Rentals, Inc. or ITT Inc.
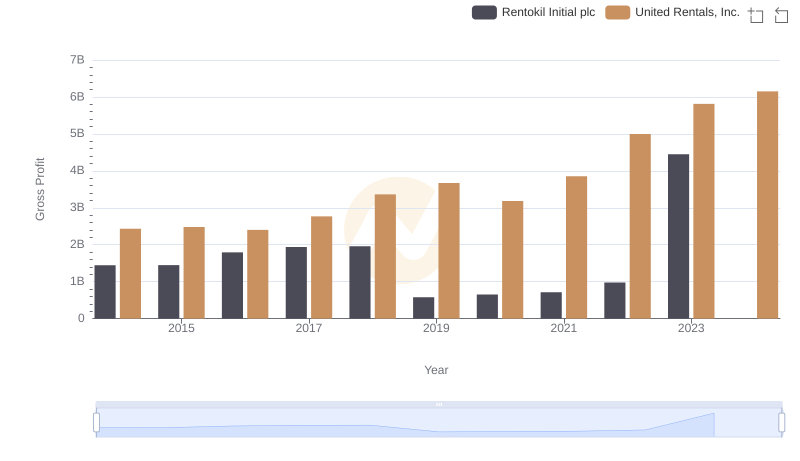
Who Generates Higher Gross Profit? United Rentals, Inc. or Rentokil Initial plc
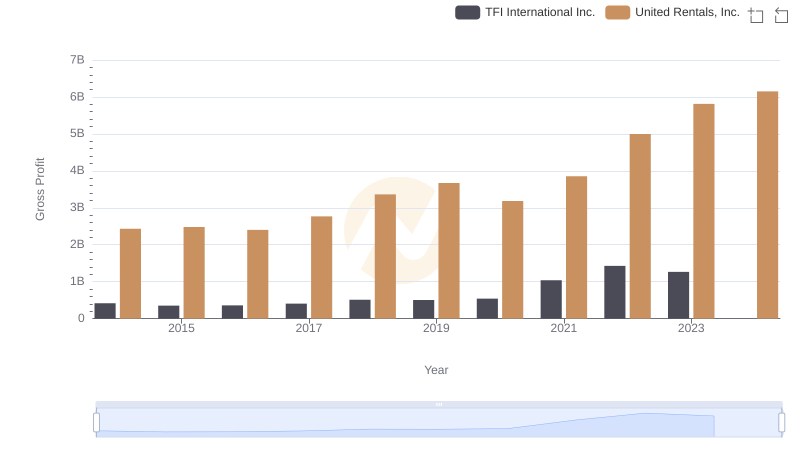
Gross Profit Trends Compared: United Rentals, Inc. vs TFI International Inc.
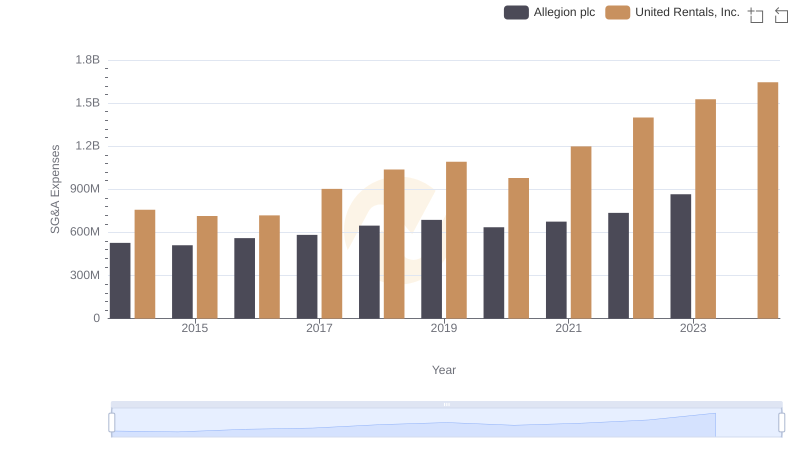
United Rentals, Inc. vs Allegion plc: SG&A Expense Trends

EBITDA Metrics Evaluated: United Rentals, Inc. vs Allegion plc