| __timestamp | Rentokil Initial plc | United Rentals, Inc. |
|---|---|---|
| Wednesday, January 1, 2014 | 410400000 | 1678000000 |
| Thursday, January 1, 2015 | 408700000 | 2653000000 |
| Friday, January 1, 2016 | 489000000 | 2566000000 |
| Sunday, January 1, 2017 | 503200000 | 2843000000 |
| Monday, January 1, 2018 | 149800000 | 3628000000 |
| Tuesday, January 1, 2019 | 580600000 | 4200000000 |
| Wednesday, January 1, 2020 | 581000000 | 2195000000 |
| Friday, January 1, 2021 | 656000000 | 2642000000 |
| Saturday, January 1, 2022 | 767000000 | 5464000000 |
| Sunday, January 1, 2023 | 1157000000 | 6627000000 |
| Monday, January 1, 2024 | 4516000000 |
Unleashing the power of data
In the dynamic world of equipment rental and services, United Rentals, Inc. and Rentokil Initial plc have emerged as industry leaders. Over the past decade, United Rentals has consistently outperformed Rentokil Initial in terms of EBITDA, showcasing a robust growth trajectory. From 2014 to 2023, United Rentals' EBITDA surged by nearly 295%, peaking in 2023, while Rentokil Initial saw a more modest increase of approximately 182% over the same period. This stark contrast highlights United Rentals' strategic expansion and operational efficiency.
Interestingly, 2018 marked a challenging year for Rentokil Initial, with a significant dip in EBITDA, whereas United Rentals continued its upward momentum. The data for 2024 is incomplete, but the trends suggest United Rentals' dominance is likely to persist. This analysis underscores the importance of strategic planning and market adaptation in maintaining competitive advantage.
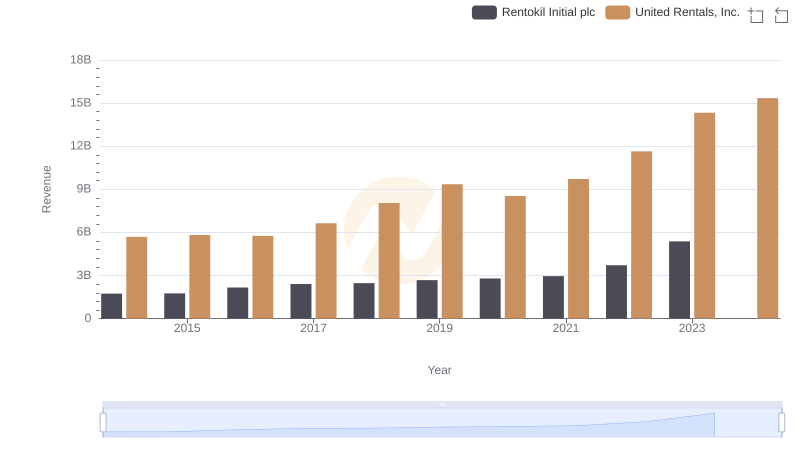
Revenue Showdown: United Rentals, Inc. vs Rentokil Initial plc
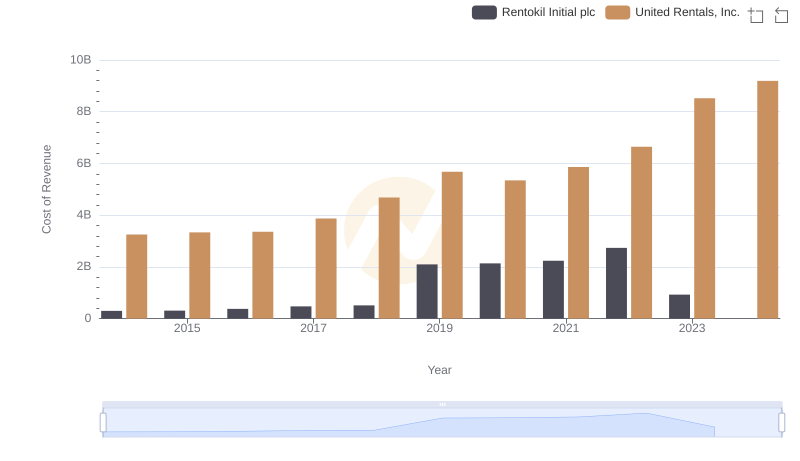
Cost of Revenue: Key Insights for United Rentals, Inc. and Rentokil Initial plc
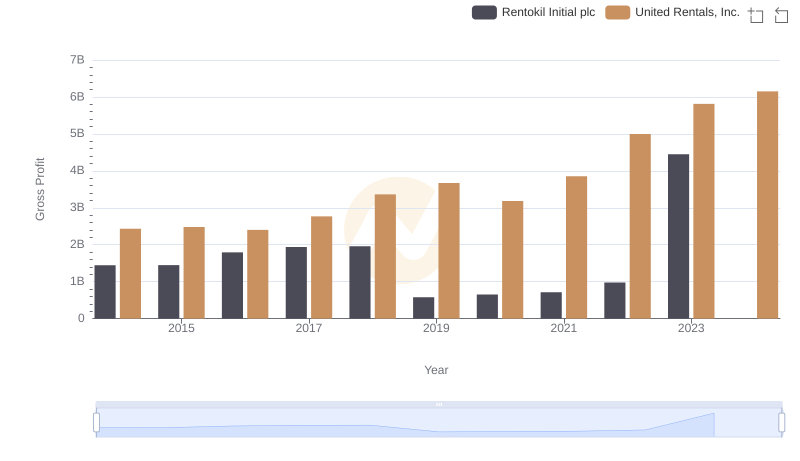
Who Generates Higher Gross Profit? United Rentals, Inc. or Rentokil Initial plc
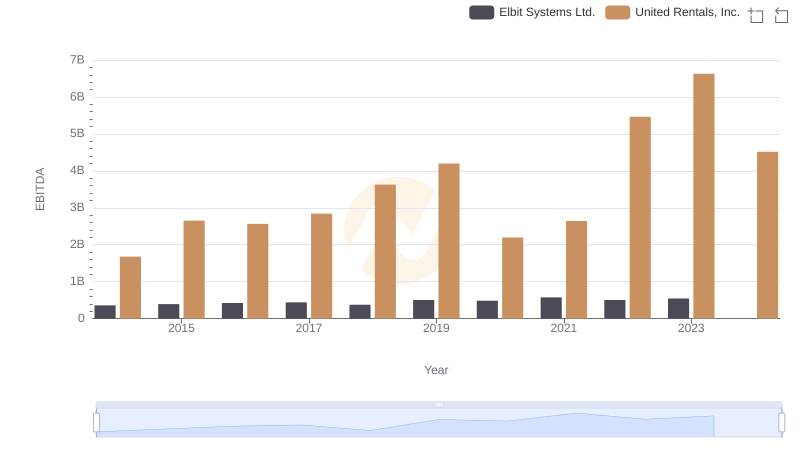
A Side-by-Side Analysis of EBITDA: United Rentals, Inc. and Elbit Systems Ltd.
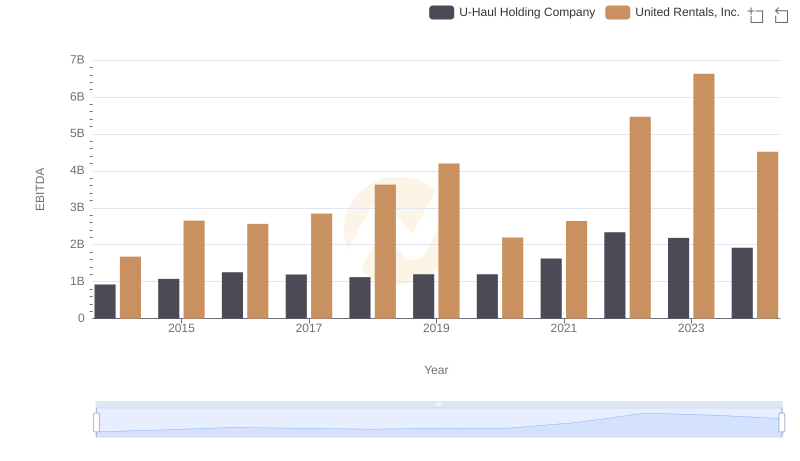
EBITDA Metrics Evaluated: United Rentals, Inc. vs U-Haul Holding Company
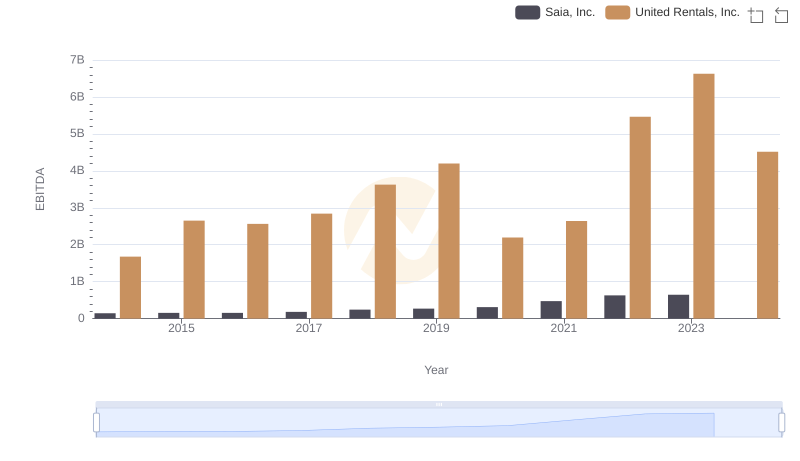
United Rentals, Inc. vs Saia, Inc.: In-Depth EBITDA Performance Comparison
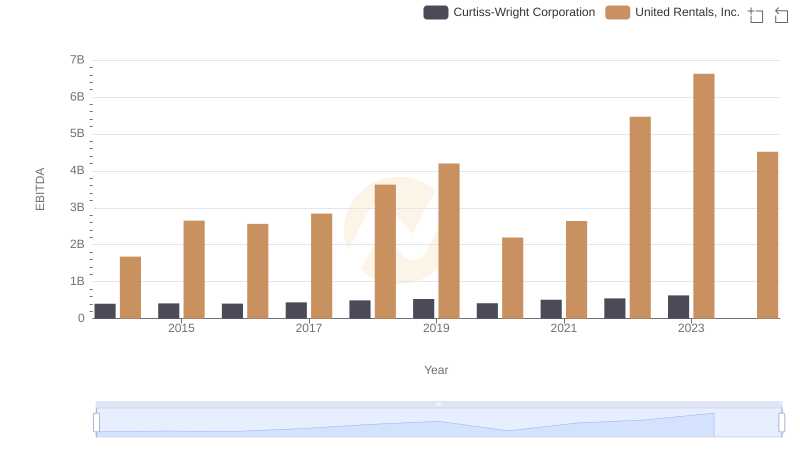
Comparative EBITDA Analysis: United Rentals, Inc. vs Curtiss-Wright Corporation
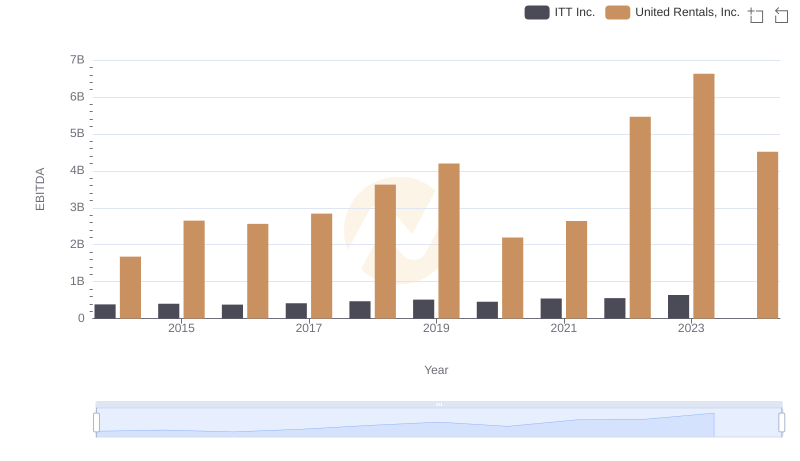
Comprehensive EBITDA Comparison: United Rentals, Inc. vs ITT Inc.
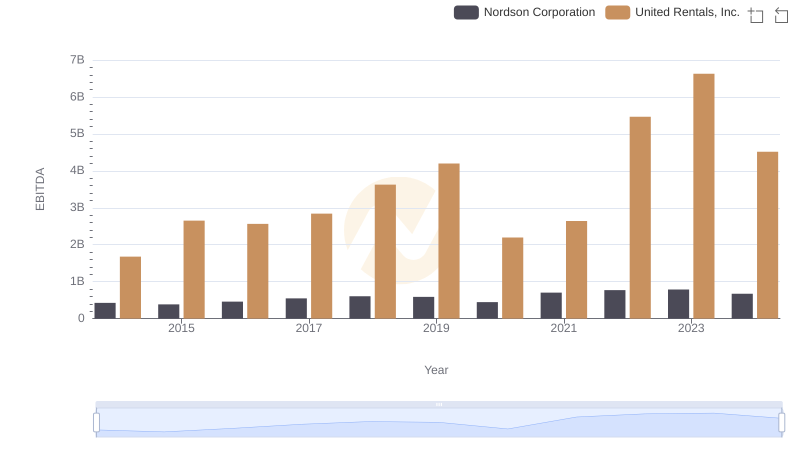
Comprehensive EBITDA Comparison: United Rentals, Inc. vs Nordson Corporation
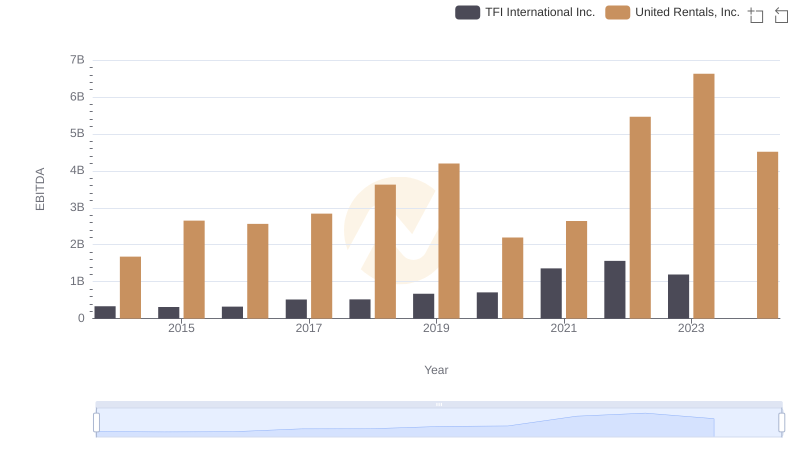
A Professional Review of EBITDA: United Rentals, Inc. Compared to TFI International Inc.
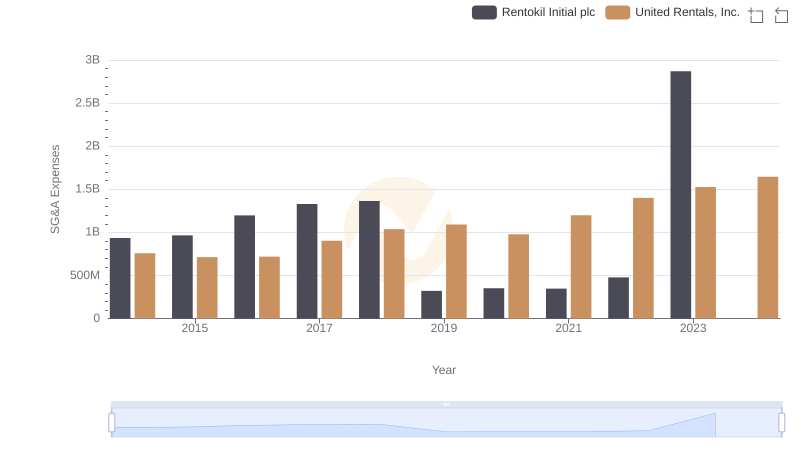
United Rentals, Inc. or Rentokil Initial plc: Who Manages SG&A Costs Better?

EBITDA Metrics Evaluated: United Rentals, Inc. vs Allegion plc