| __timestamp | Saia, Inc. | United Rentals, Inc. |
|---|---|---|
| Wednesday, January 1, 2014 | 144715000 | 1678000000 |
| Thursday, January 1, 2015 | 154995000 | 2653000000 |
| Friday, January 1, 2016 | 156092000 | 2566000000 |
| Sunday, January 1, 2017 | 181629000 | 2843000000 |
| Monday, January 1, 2018 | 243709000 | 3628000000 |
| Tuesday, January 1, 2019 | 271318000 | 4200000000 |
| Wednesday, January 1, 2020 | 312448000 | 2195000000 |
| Friday, January 1, 2021 | 472947000 | 2642000000 |
| Saturday, January 1, 2022 | 627741000 | 5464000000 |
| Sunday, January 1, 2023 | 647607000 | 6627000000 |
| Monday, January 1, 2024 | 4516000000 |
Infusing magic into the data realm
In the competitive landscape of the equipment rental and logistics industries, United Rentals, Inc. and Saia, Inc. have showcased remarkable EBITDA growth over the past decade. From 2014 to 2023, United Rentals, Inc. has consistently outperformed, with its EBITDA surging by nearly 295%, peaking at approximately $6.63 billion in 2023. Meanwhile, Saia, Inc. has demonstrated impressive growth, with its EBITDA increasing by over 347% during the same period, reaching around $647 million in 2023.
The data highlights a significant upward trend for both companies, with United Rentals, Inc. maintaining a robust lead. However, Saia, Inc.'s rapid growth trajectory is noteworthy, reflecting its strategic expansions and operational efficiencies. The missing data for 2024 suggests a potential shift or anomaly, inviting further analysis into future performance expectations.

Breaking Down Revenue Trends: United Rentals, Inc. vs Saia, Inc.
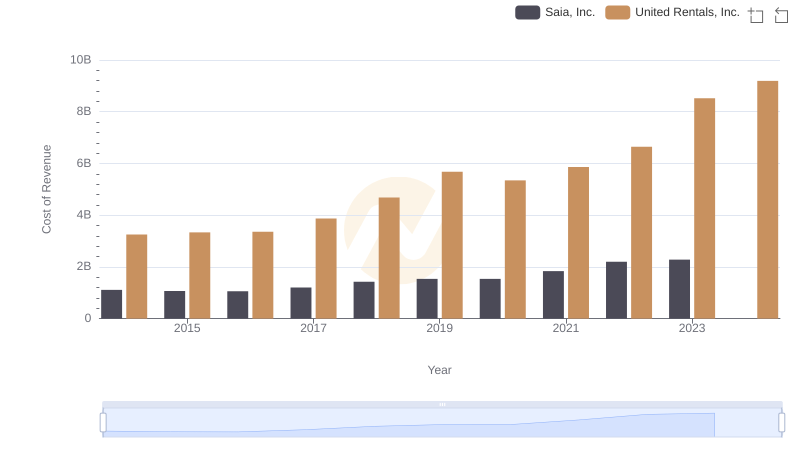
Cost of Revenue Comparison: United Rentals, Inc. vs Saia, Inc.
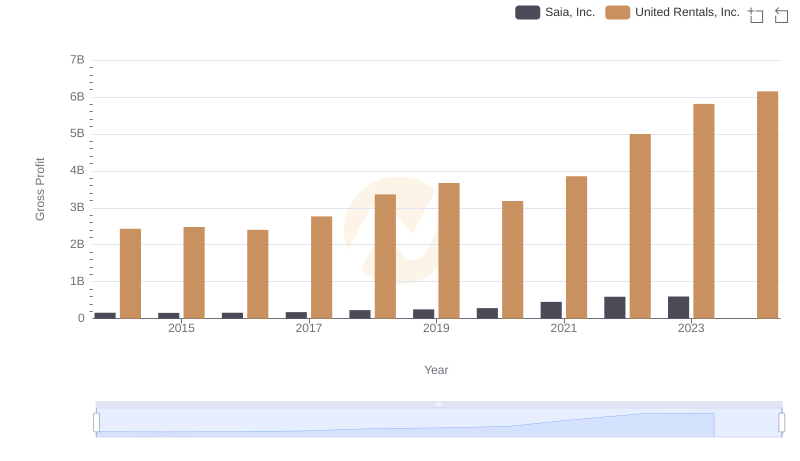
Gross Profit Comparison: United Rentals, Inc. and Saia, Inc. Trends
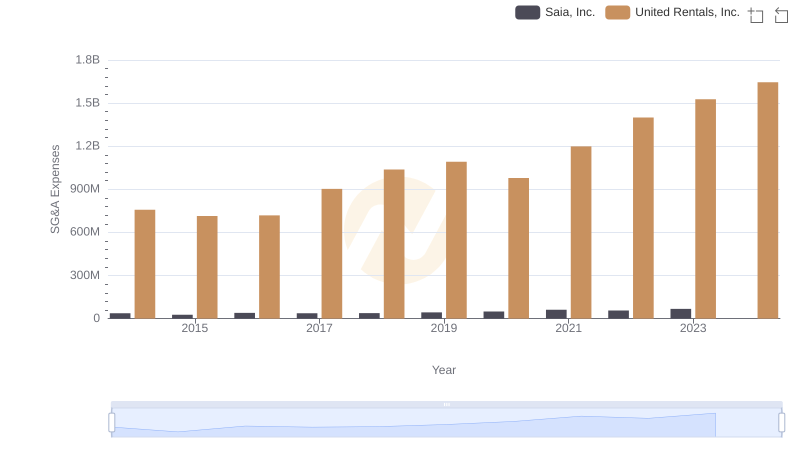
Breaking Down SG&A Expenses: United Rentals, Inc. vs Saia, Inc.
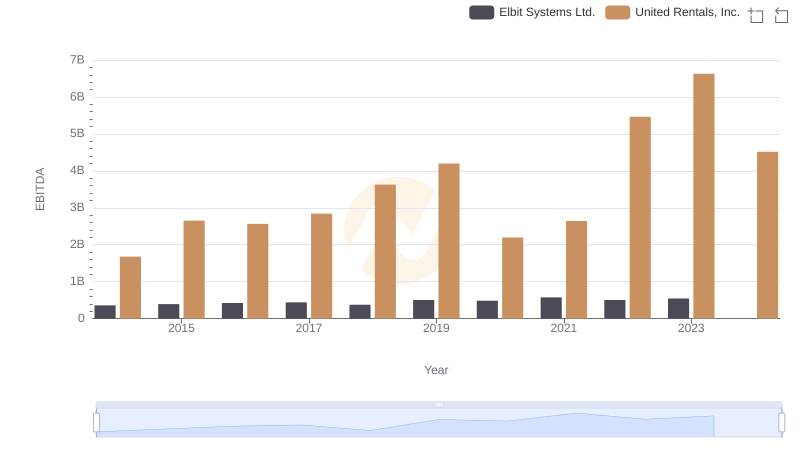
A Side-by-Side Analysis of EBITDA: United Rentals, Inc. and Elbit Systems Ltd.
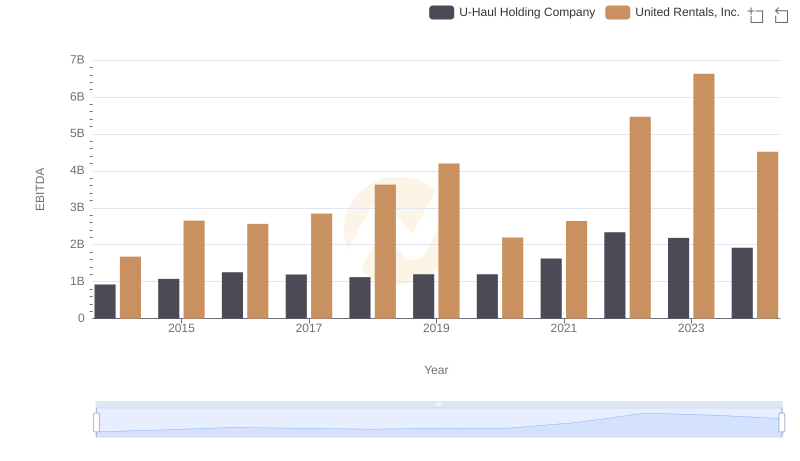
EBITDA Metrics Evaluated: United Rentals, Inc. vs U-Haul Holding Company
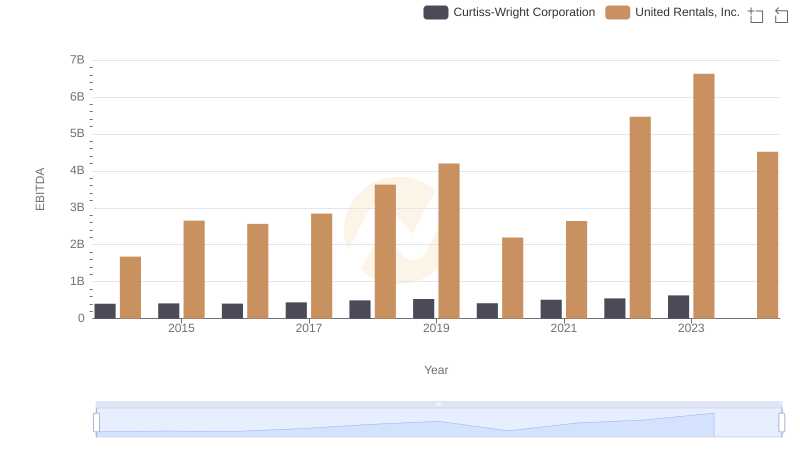
Comparative EBITDA Analysis: United Rentals, Inc. vs Curtiss-Wright Corporation
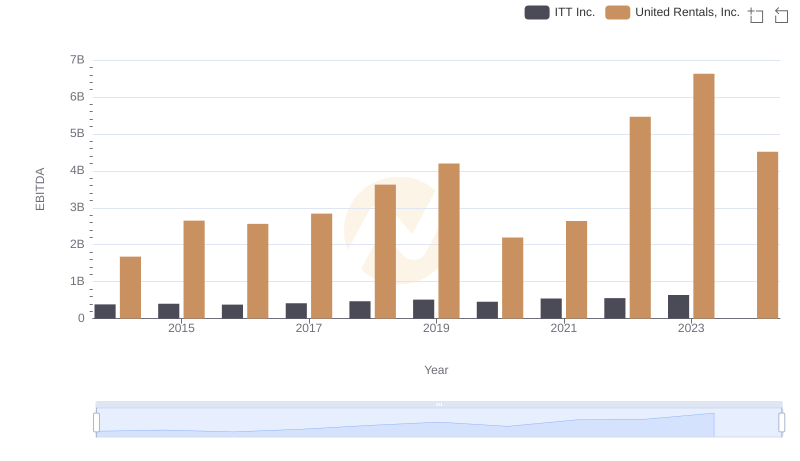
Comprehensive EBITDA Comparison: United Rentals, Inc. vs ITT Inc.
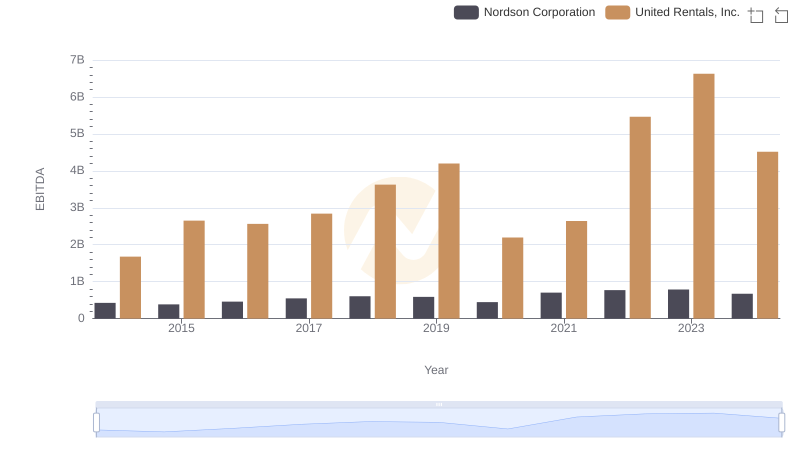
Comprehensive EBITDA Comparison: United Rentals, Inc. vs Nordson Corporation
A Professional Review of EBITDA: United Rentals, Inc. Compared to TFI International Inc.