| __timestamp | U-Haul Holding Company | United Rentals, Inc. |
|---|---|---|
| Wednesday, January 1, 2014 | 923383000 | 1678000000 |
| Thursday, January 1, 2015 | 1076520000 | 2653000000 |
| Friday, January 1, 2016 | 1255474000 | 2566000000 |
| Sunday, January 1, 2017 | 1195593000 | 2843000000 |
| Monday, January 1, 2018 | 1123974000 | 3628000000 |
| Tuesday, January 1, 2019 | 1200955000 | 4200000000 |
| Wednesday, January 1, 2020 | 1202436000 | 2195000000 |
| Friday, January 1, 2021 | 1627442000 | 2642000000 |
| Saturday, January 1, 2022 | 2337788000 | 5464000000 |
| Sunday, January 1, 2023 | 2183839000 | 6627000000 |
| Monday, January 1, 2024 | 1919656000 | 4516000000 |
Unveiling the hidden dimensions of data
In the competitive landscape of equipment rental and moving services, United Rentals, Inc. and U-Haul Holding Company have been pivotal players. Over the past decade, United Rentals has consistently outperformed U-Haul in terms of EBITDA, showcasing a robust growth trajectory. From 2014 to 2023, United Rentals' EBITDA surged by nearly 295%, peaking in 2023, while U-Haul's EBITDA grew by approximately 137% during the same period.
This analysis underscores the dynamic nature of the equipment rental and moving industry, with United Rentals leading the charge.
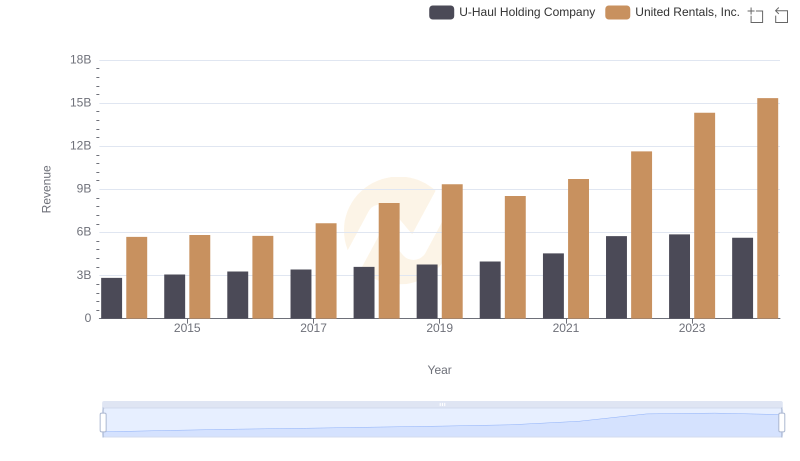
Revenue Showdown: United Rentals, Inc. vs U-Haul Holding Company
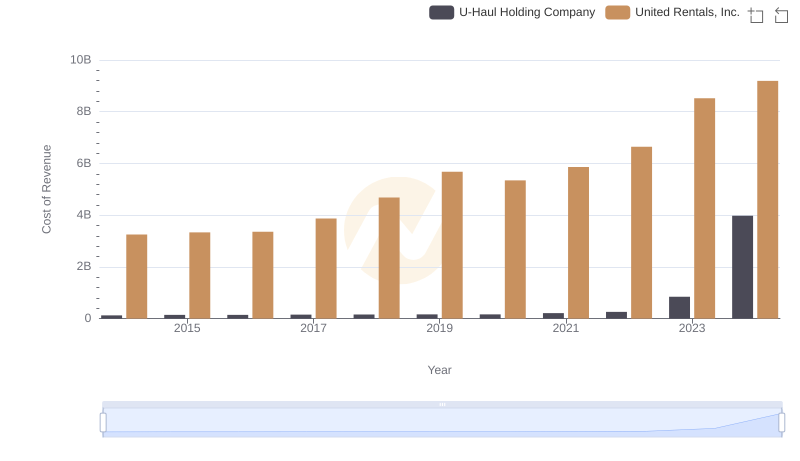
Cost of Revenue Comparison: United Rentals, Inc. vs U-Haul Holding Company

Gross Profit Comparison: United Rentals, Inc. and U-Haul Holding Company Trends
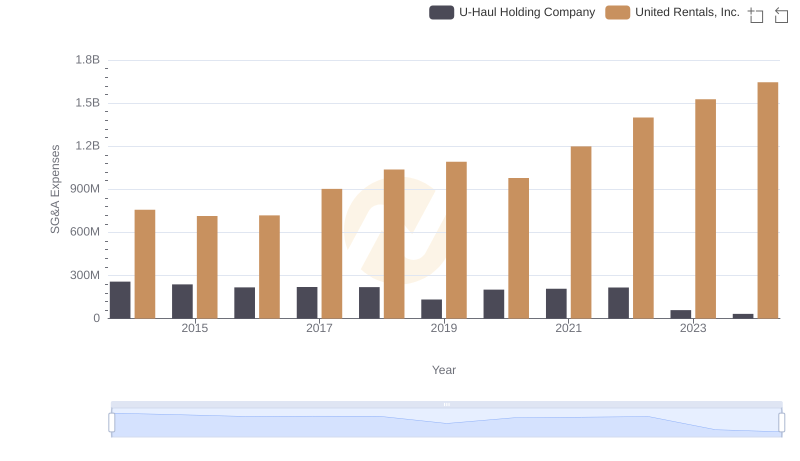
Comparing SG&A Expenses: United Rentals, Inc. vs U-Haul Holding Company Trends and Insights

Comprehensive EBITDA Comparison: United Rentals, Inc. vs Stanley Black & Decker, Inc.
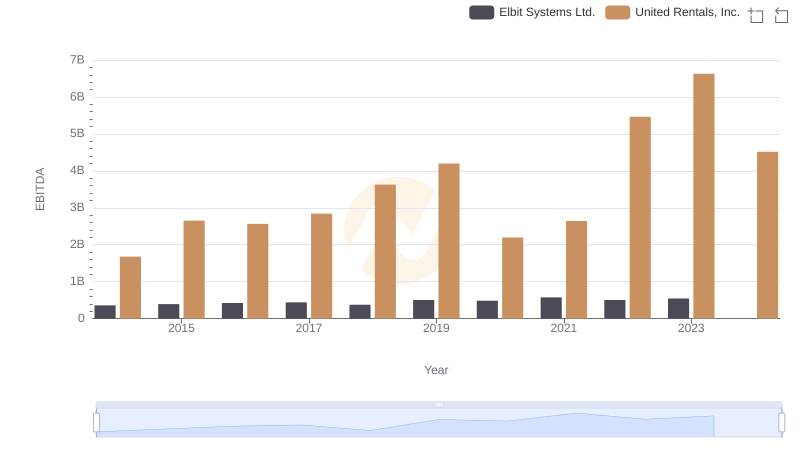
A Side-by-Side Analysis of EBITDA: United Rentals, Inc. and Elbit Systems Ltd.
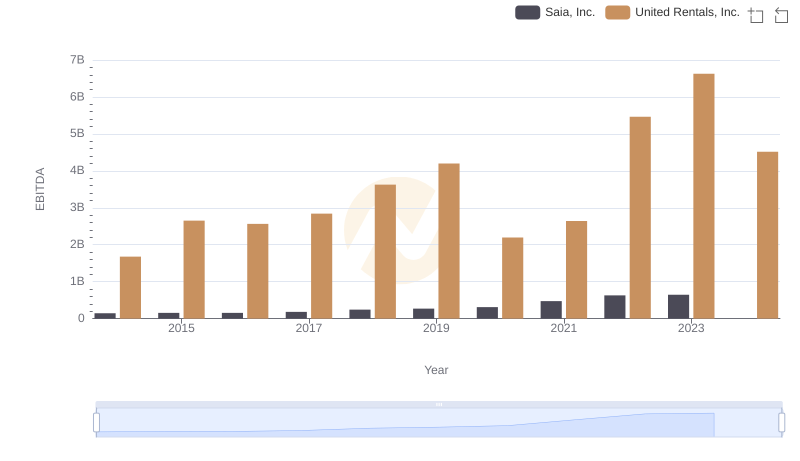
United Rentals, Inc. vs Saia, Inc.: In-Depth EBITDA Performance Comparison
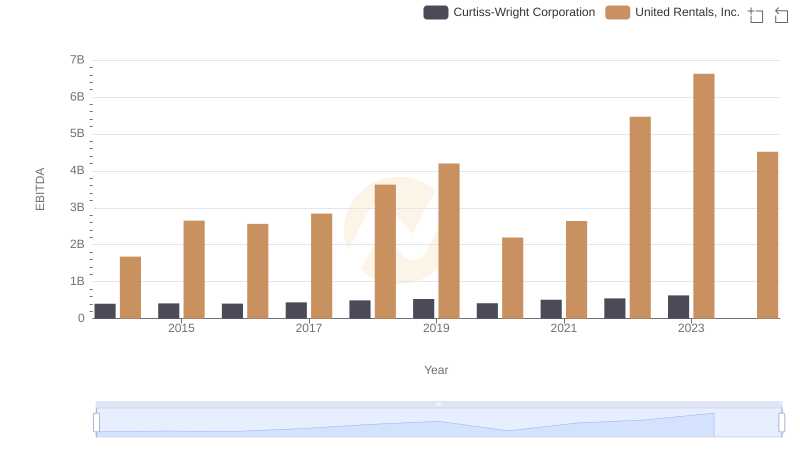
Comparative EBITDA Analysis: United Rentals, Inc. vs Curtiss-Wright Corporation
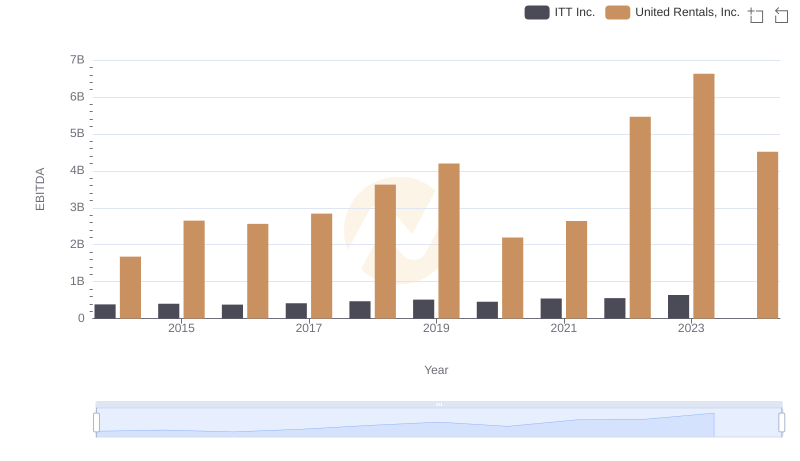
Comprehensive EBITDA Comparison: United Rentals, Inc. vs ITT Inc.
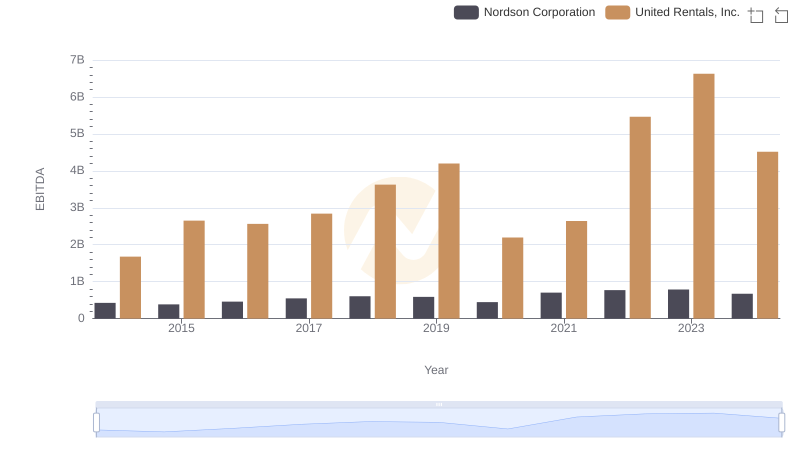
Comprehensive EBITDA Comparison: United Rentals, Inc. vs Nordson Corporation