| __timestamp | Curtiss-Wright Corporation | United Rentals, Inc. |
|---|---|---|
| Wednesday, January 1, 2014 | 401669000 | 1678000000 |
| Thursday, January 1, 2015 | 412042000 | 2653000000 |
| Friday, January 1, 2016 | 405217000 | 2566000000 |
| Sunday, January 1, 2017 | 441085000 | 2843000000 |
| Monday, January 1, 2018 | 493171000 | 3628000000 |
| Tuesday, January 1, 2019 | 530221000 | 4200000000 |
| Wednesday, January 1, 2020 | 414499000 | 2195000000 |
| Friday, January 1, 2021 | 509134000 | 2642000000 |
| Saturday, January 1, 2022 | 548202000 | 5464000000 |
| Sunday, January 1, 2023 | 630635000 | 6627000000 |
| Monday, January 1, 2024 | 674592000 | 4516000000 |
Unleashing the power of data
In the competitive landscape of industrial giants, United Rentals, Inc. and Curtiss-Wright Corporation have showcased remarkable financial trajectories over the past decade. From 2014 to 2023, United Rentals has consistently outperformed Curtiss-Wright in terms of EBITDA, with a staggering growth of nearly 295% from 2014 to 2023. This growth highlights United Rentals' strategic expansions and operational efficiencies. In contrast, Curtiss-Wright, while more modest in its growth, has seen a steady increase of approximately 57% over the same period, reflecting its stable market presence and gradual innovation.
The year 2023 marked a peak for both companies, with United Rentals achieving an EBITDA of 6.63 billion, a testament to its robust market strategies. Meanwhile, Curtiss-Wright reached 630 million, indicating a strong finish to the decade. However, data for 2024 is incomplete, leaving room for speculation on future trends.
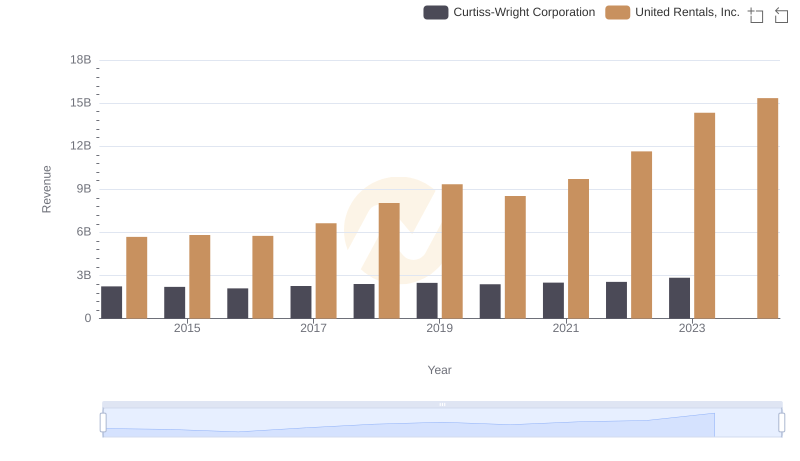
Who Generates More Revenue? United Rentals, Inc. or Curtiss-Wright Corporation
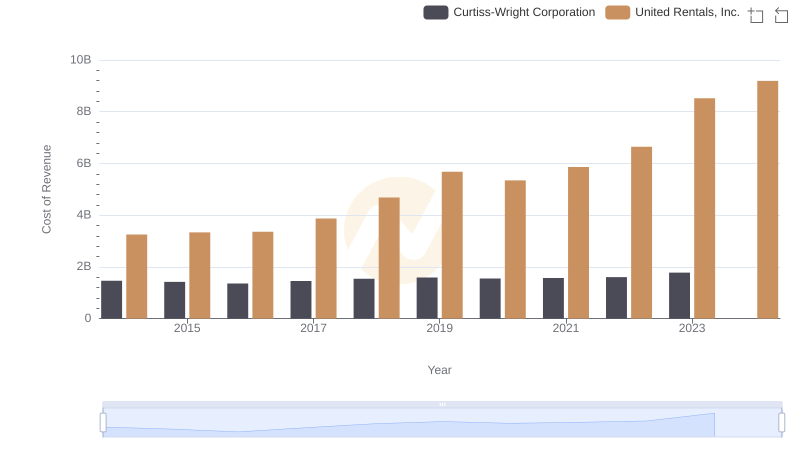
Cost of Revenue Trends: United Rentals, Inc. vs Curtiss-Wright Corporation

United Rentals, Inc. and Curtiss-Wright Corporation: A Detailed Gross Profit Analysis

Comparing SG&A Expenses: United Rentals, Inc. vs Curtiss-Wright Corporation Trends and Insights
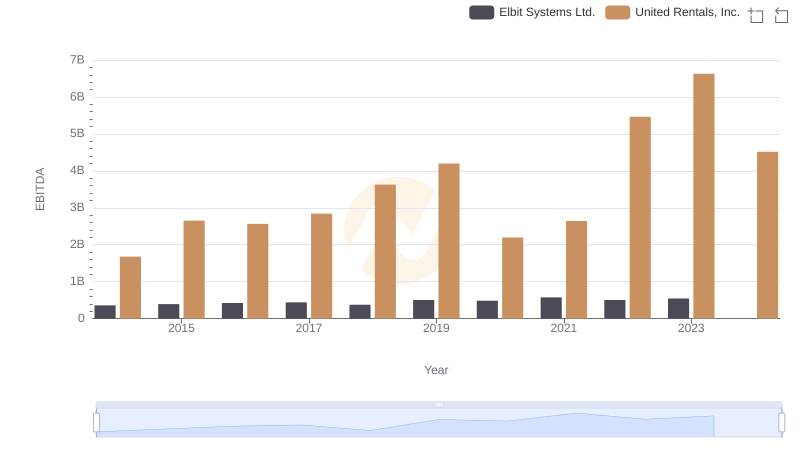
A Side-by-Side Analysis of EBITDA: United Rentals, Inc. and Elbit Systems Ltd.
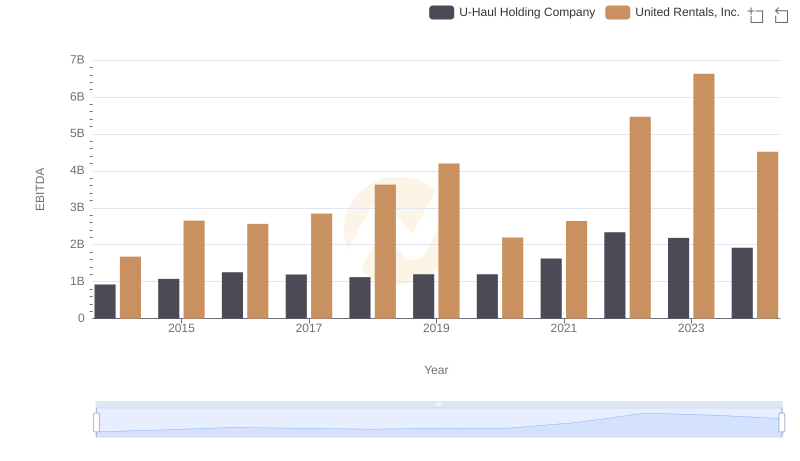
EBITDA Metrics Evaluated: United Rentals, Inc. vs U-Haul Holding Company
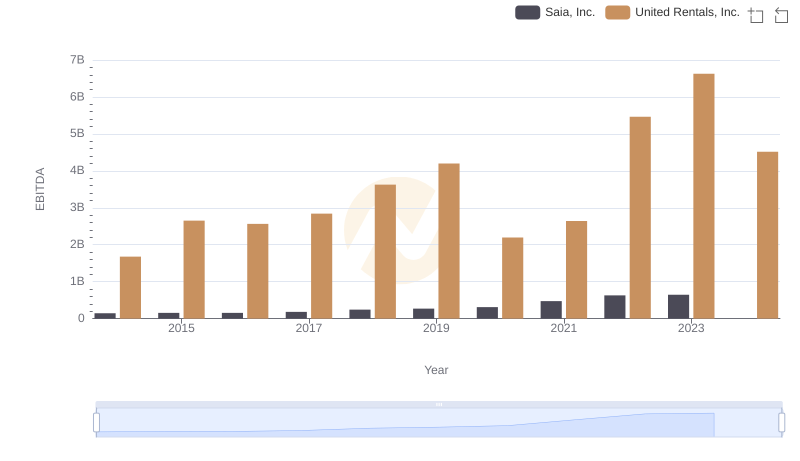
United Rentals, Inc. vs Saia, Inc.: In-Depth EBITDA Performance Comparison
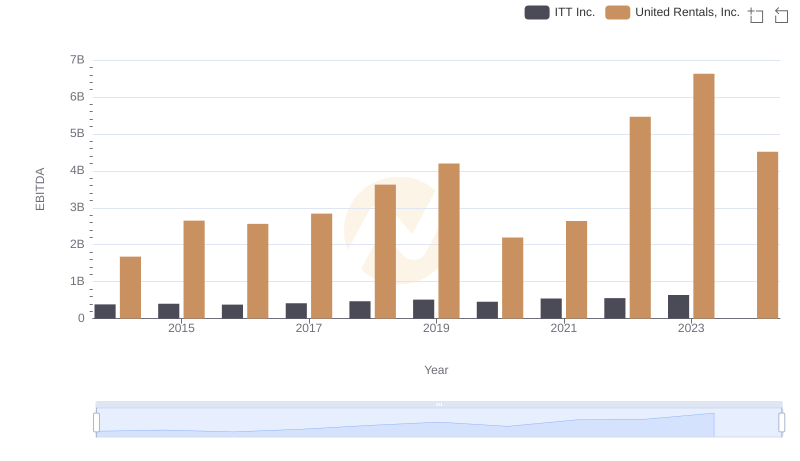
Comprehensive EBITDA Comparison: United Rentals, Inc. vs ITT Inc.
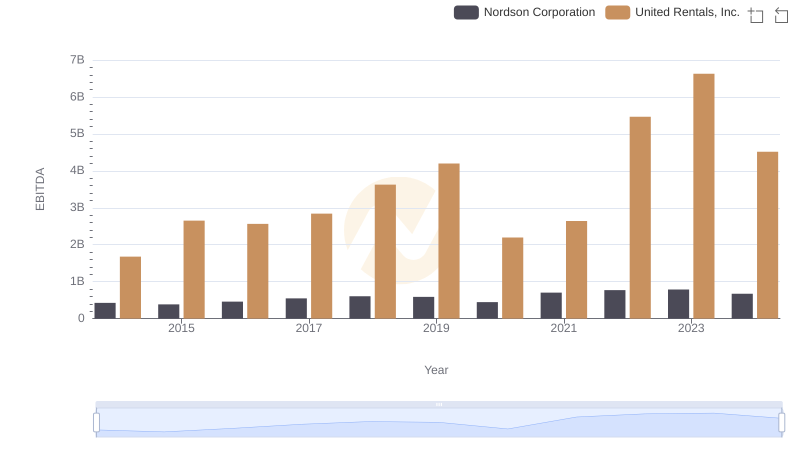
Comprehensive EBITDA Comparison: United Rentals, Inc. vs Nordson Corporation
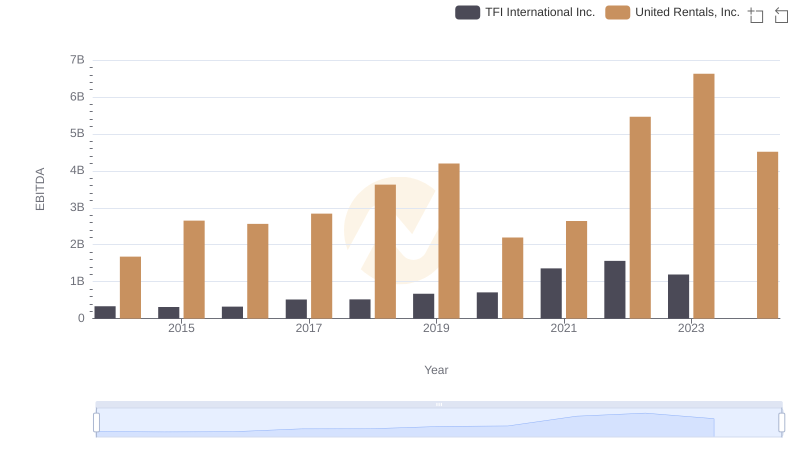
A Professional Review of EBITDA: United Rentals, Inc. Compared to TFI International Inc.