| __timestamp | ITT Inc. | United Rentals, Inc. |
|---|---|---|
| Wednesday, January 1, 2014 | 386700000 | 1678000000 |
| Thursday, January 1, 2015 | 402700000 | 2653000000 |
| Friday, January 1, 2016 | 378000000 | 2566000000 |
| Sunday, January 1, 2017 | 415000000 | 2843000000 |
| Monday, January 1, 2018 | 469000000 | 3628000000 |
| Tuesday, January 1, 2019 | 513900000 | 4200000000 |
| Wednesday, January 1, 2020 | 455000000 | 2195000000 |
| Friday, January 1, 2021 | 545600000 | 2642000000 |
| Saturday, January 1, 2022 | 554500000 | 5464000000 |
| Sunday, January 1, 2023 | 639100000 | 6627000000 |
| Monday, January 1, 2024 | 821500000 | 4516000000 |
Unleashing the power of data
In the ever-evolving landscape of industrial services, United Rentals, Inc. and ITT Inc. have showcased remarkable financial trajectories over the past decade. From 2014 to 2023, United Rentals, Inc. has consistently outperformed ITT Inc. in terms of EBITDA, with a staggering growth of nearly 295% from 2014 to 2023. This growth underscores United Rentals' strategic expansions and market adaptability.
Conversely, ITT Inc. has demonstrated steady growth, with a 65% increase in EBITDA over the same period. This reflects ITT's resilience and focus on innovation in its core sectors. Notably, 2023 marked a peak for both companies, with United Rentals achieving its highest EBITDA, while ITT Inc. also reached a new high. However, data for 2024 remains incomplete, leaving room for speculation on future trends.
These insights highlight the dynamic nature of the industrial sector and the strategic maneuvers of these industry giants.
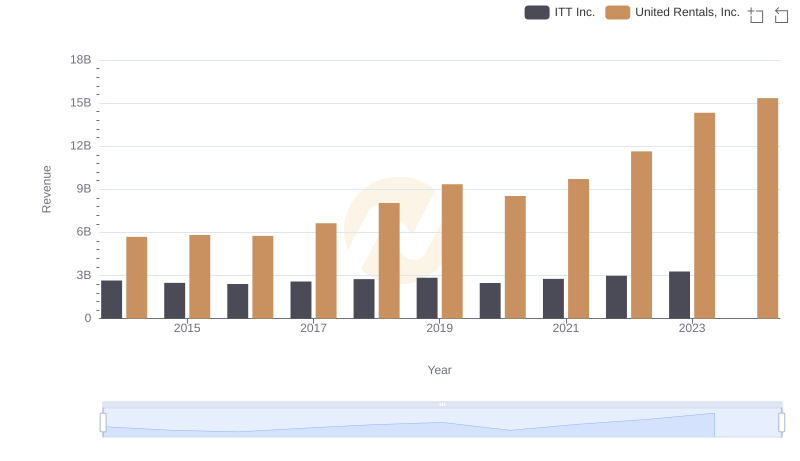
United Rentals, Inc. vs ITT Inc.: Annual Revenue Growth Compared
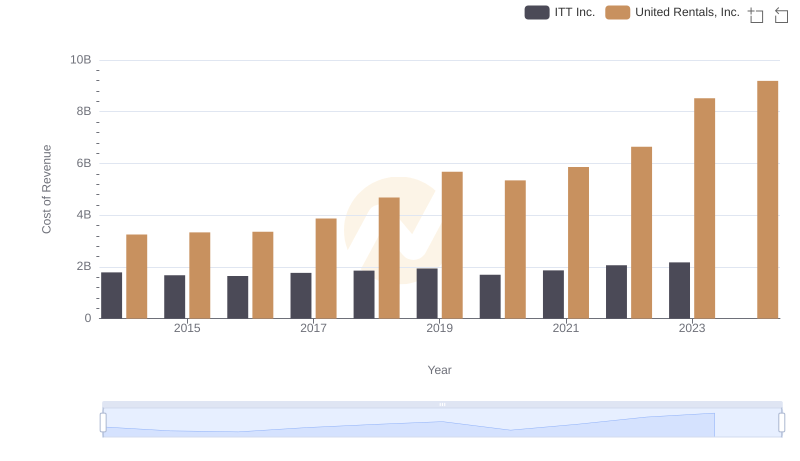
Cost of Revenue Comparison: United Rentals, Inc. vs ITT Inc.
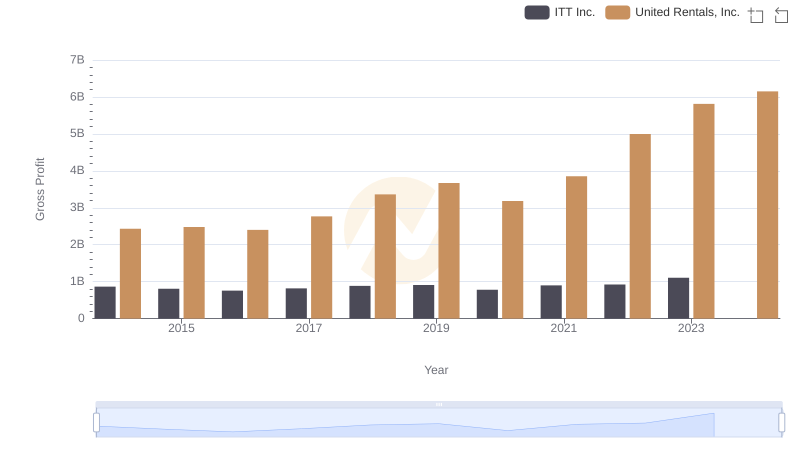
Who Generates Higher Gross Profit? United Rentals, Inc. or ITT Inc.
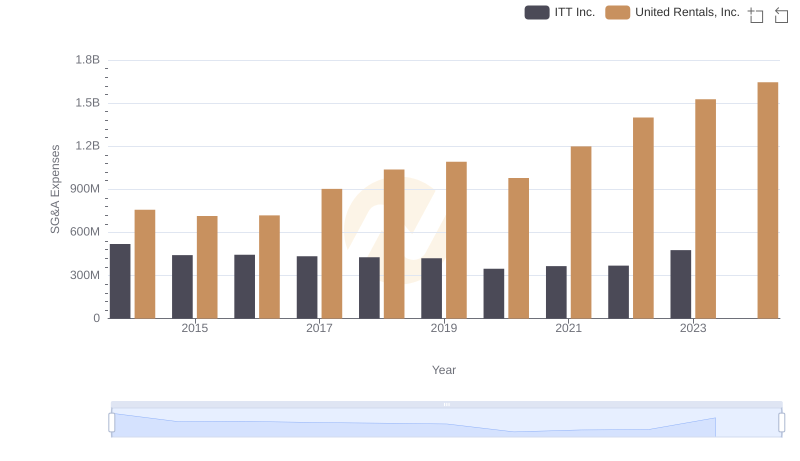
SG&A Efficiency Analysis: Comparing United Rentals, Inc. and ITT Inc.
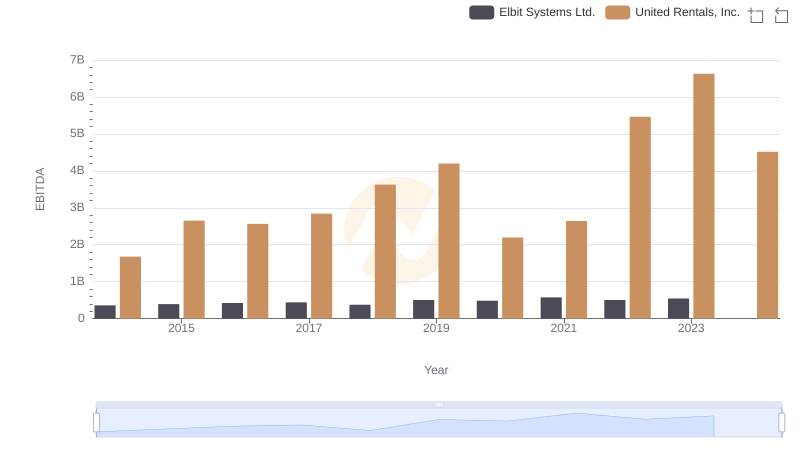
A Side-by-Side Analysis of EBITDA: United Rentals, Inc. and Elbit Systems Ltd.
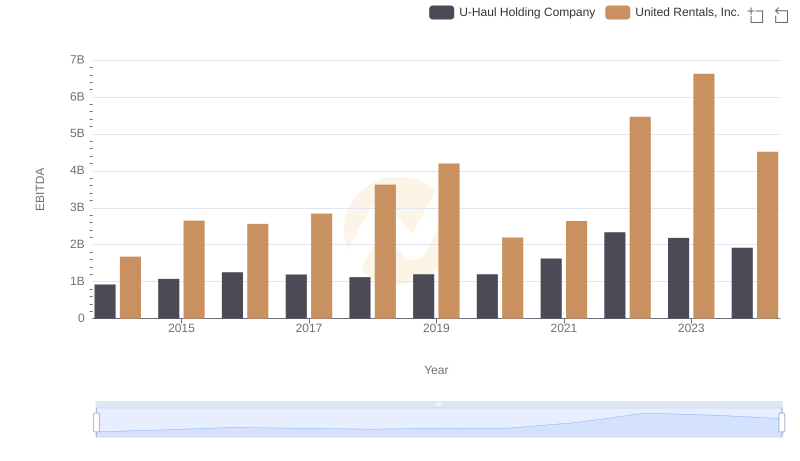
EBITDA Metrics Evaluated: United Rentals, Inc. vs U-Haul Holding Company
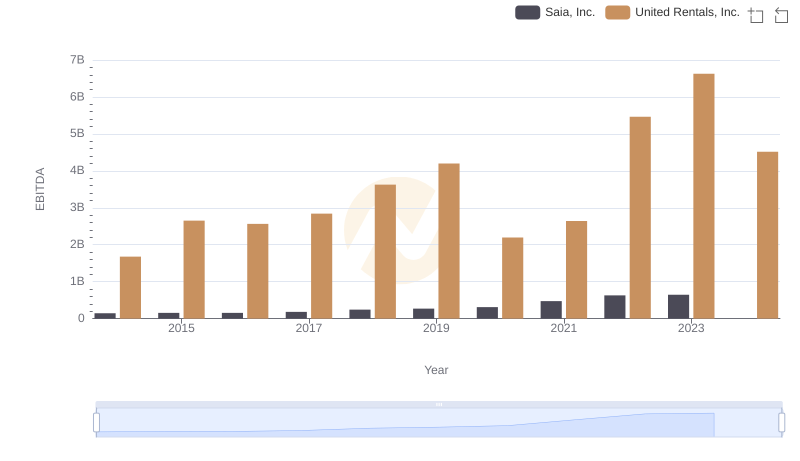
United Rentals, Inc. vs Saia, Inc.: In-Depth EBITDA Performance Comparison
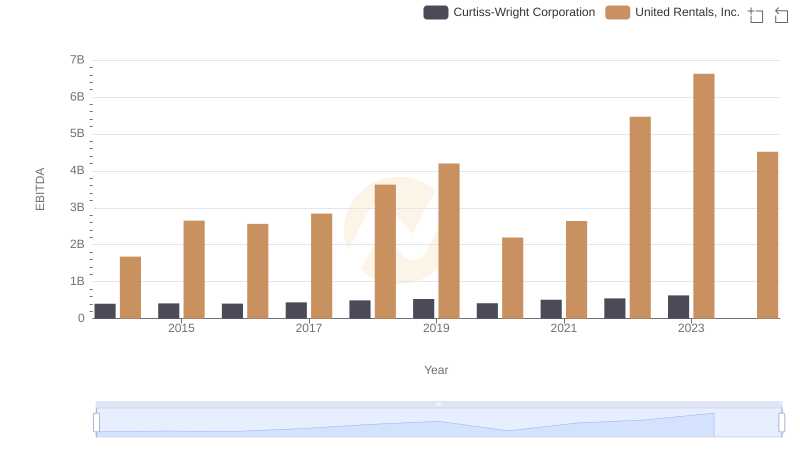
Comparative EBITDA Analysis: United Rentals, Inc. vs Curtiss-Wright Corporation
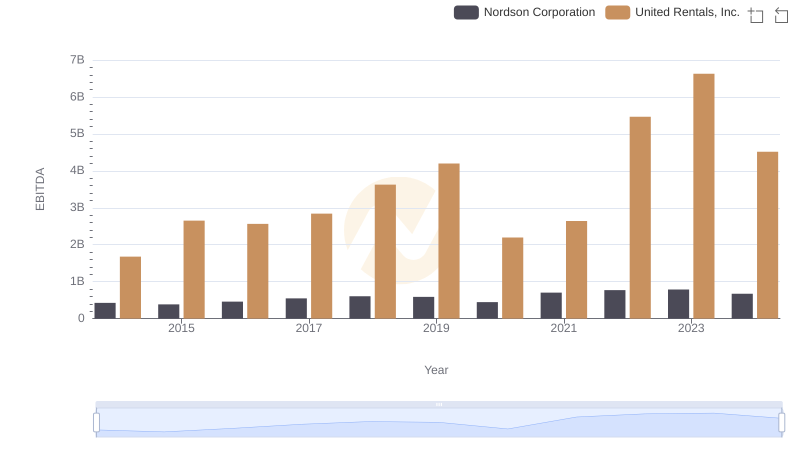
Comprehensive EBITDA Comparison: United Rentals, Inc. vs Nordson Corporation
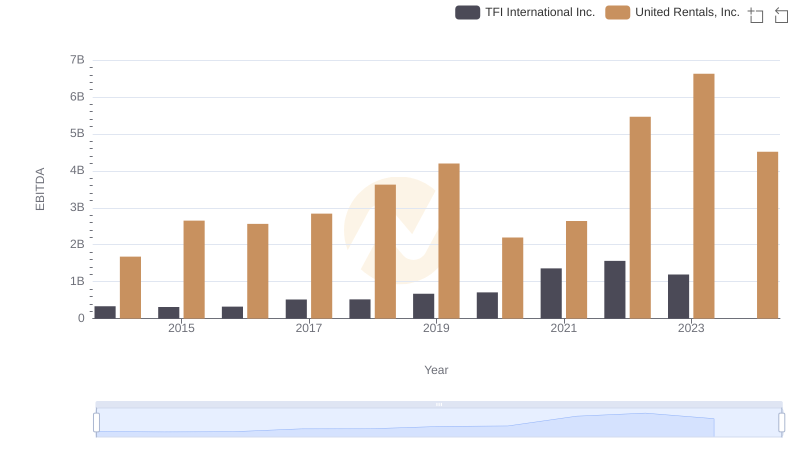
A Professional Review of EBITDA: United Rentals, Inc. Compared to TFI International Inc.