| __timestamp | TFI International Inc. | United Rentals, Inc. |
|---|---|---|
| Wednesday, January 1, 2014 | 334908602 | 1678000000 |
| Thursday, January 1, 2015 | 314924803 | 2653000000 |
| Friday, January 1, 2016 | 325584405 | 2566000000 |
| Sunday, January 1, 2017 | 517899005 | 2843000000 |
| Monday, January 1, 2018 | 521265317 | 3628000000 |
| Tuesday, January 1, 2019 | 674440000 | 4200000000 |
| Wednesday, January 1, 2020 | 709296000 | 2195000000 |
| Friday, January 1, 2021 | 1358717000 | 2642000000 |
| Saturday, January 1, 2022 | 1561728000 | 5464000000 |
| Sunday, January 1, 2023 | 1194213000 | 6627000000 |
| Monday, January 1, 2024 | 4516000000 |
Igniting the spark of knowledge
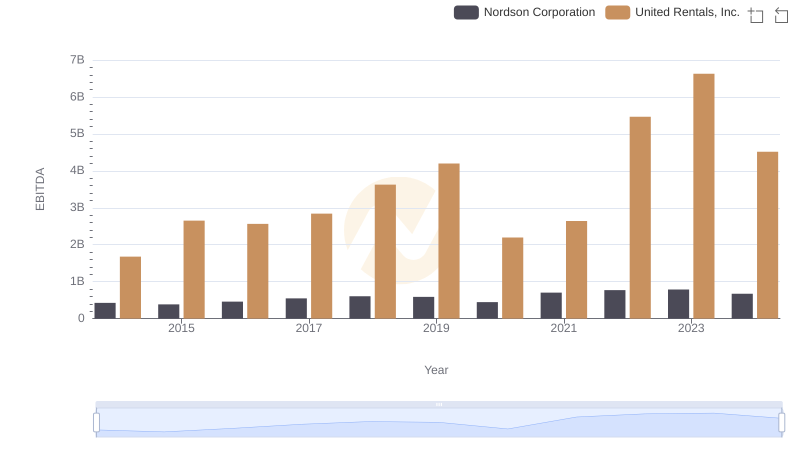
In the ever-evolving landscape of industrial services, United Rentals, Inc. and TFI International Inc. have emerged as formidable players. Over the past decade, United Rentals has consistently outperformed TFI International in terms of EBITDA, showcasing a robust growth trajectory. From 2014 to 2023, United Rentals' EBITDA surged by nearly 295%, peaking in 2023. In contrast, TFI International experienced a more modest growth of approximately 278% during the same period.
This analysis underscores the dynamic nature of the industrial sector and the strategic maneuvers of these industry giants.
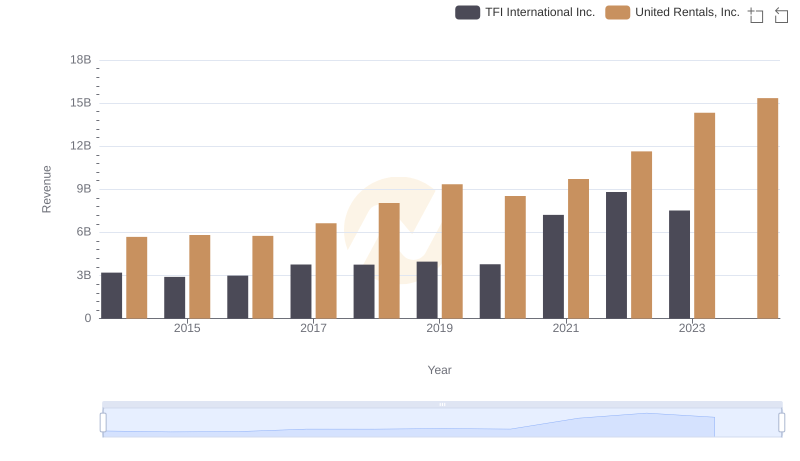
Who Generates More Revenue? United Rentals, Inc. or TFI International Inc.
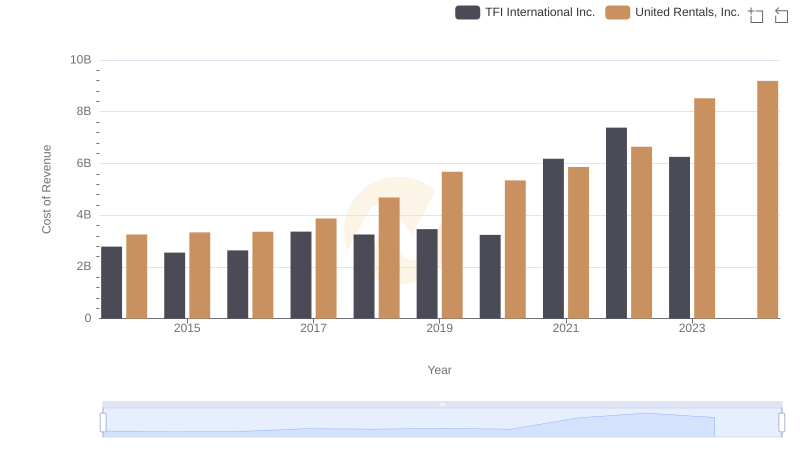
Cost Insights: Breaking Down United Rentals, Inc. and TFI International Inc.'s Expenses
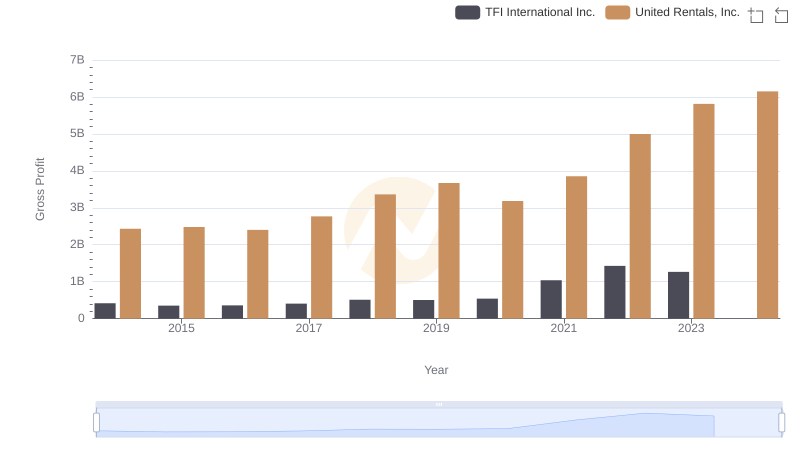
Gross Profit Trends Compared: United Rentals, Inc. vs TFI International Inc.
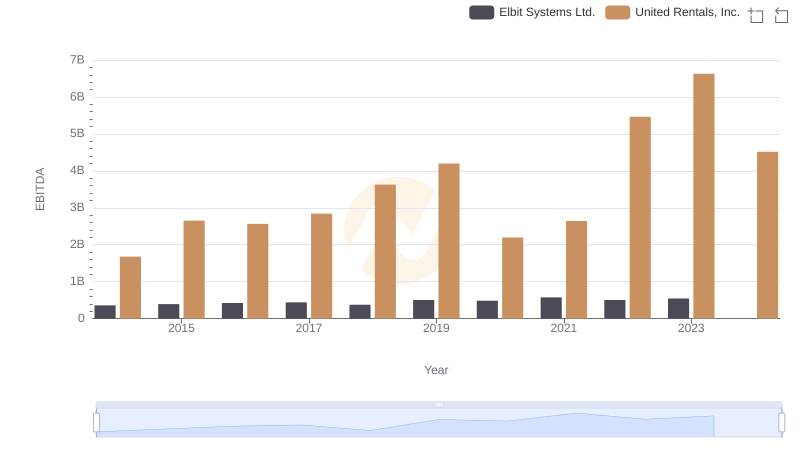
A Side-by-Side Analysis of EBITDA: United Rentals, Inc. and Elbit Systems Ltd.
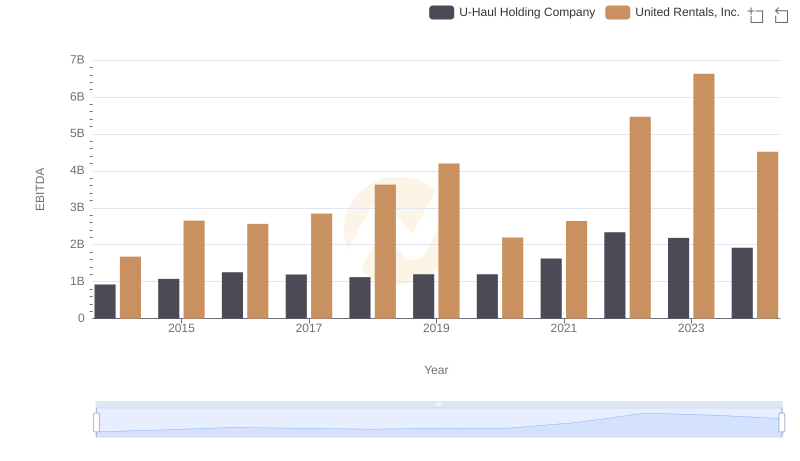
EBITDA Metrics Evaluated: United Rentals, Inc. vs U-Haul Holding Company
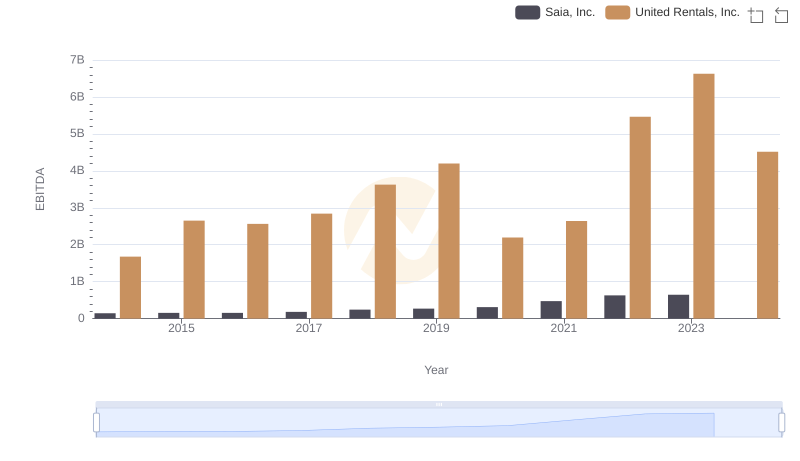
United Rentals, Inc. vs Saia, Inc.: In-Depth EBITDA Performance Comparison
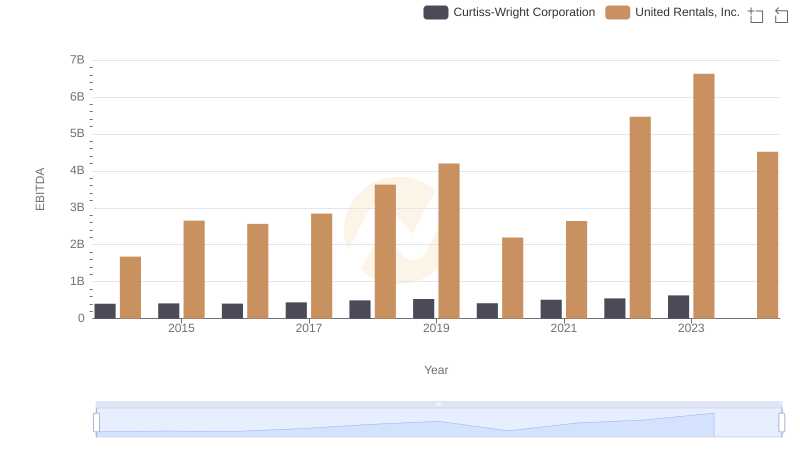
Comparative EBITDA Analysis: United Rentals, Inc. vs Curtiss-Wright Corporation
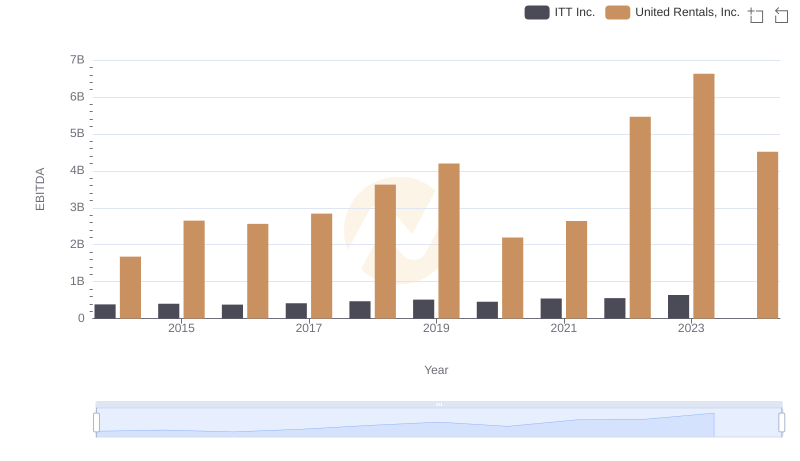
Comprehensive EBITDA Comparison: United Rentals, Inc. vs ITT Inc.
Comprehensive EBITDA Comparison: United Rentals, Inc. vs Nordson Corporation

EBITDA Metrics Evaluated: United Rentals, Inc. vs Allegion plc