| __timestamp | Parker-Hannifin Corporation | U-Haul Holding Company |
|---|---|---|
| Wednesday, January 1, 2014 | 1832903000 | 923383000 |
| Thursday, January 1, 2015 | 1861551000 | 1076520000 |
| Friday, January 1, 2016 | 1558088000 | 1255474000 |
| Sunday, January 1, 2017 | 1846306000 | 1195593000 |
| Monday, January 1, 2018 | 2382235000 | 1123974000 |
| Tuesday, January 1, 2019 | 2513468000 | 1200955000 |
| Wednesday, January 1, 2020 | 2431500000 | 1202436000 |
| Friday, January 1, 2021 | 3092383000 | 1627442000 |
| Saturday, January 1, 2022 | 2441242000 | 2337788000 |
| Sunday, January 1, 2023 | 4071687000 | 2183839000 |
| Monday, January 1, 2024 | 5028229000 | 1919656000 |
Unlocking the unknown
In the world of industrial and transportation sectors, Parker-Hannifin Corporation and U-Haul Holding Company stand as titans. Over the past decade, Parker-Hannifin has consistently outperformed U-Haul in EBITDA, showcasing a robust growth trajectory. From 2014 to 2024, Parker-Hannifin's EBITDA surged by approximately 175%, peaking in 2024. In contrast, U-Haul's EBITDA grew by around 108% during the same period, with a notable spike in 2022.
This comparison underscores the dynamic nature of these industries and the strategic maneuvers that drive financial success.
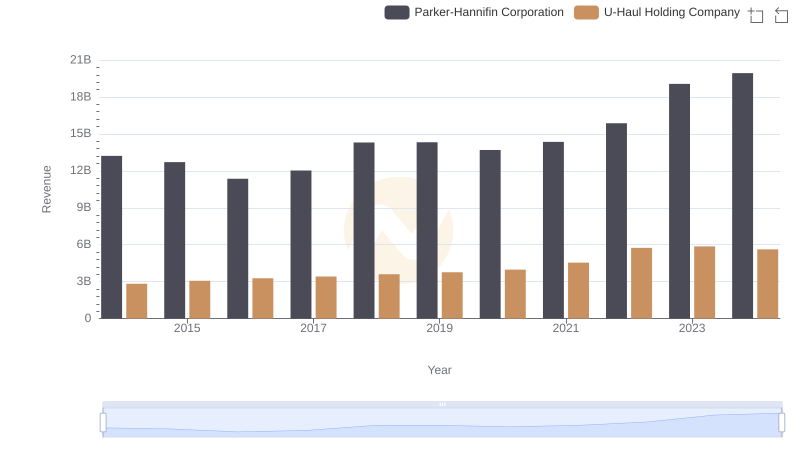
Parker-Hannifin Corporation vs U-Haul Holding Company: Annual Revenue Growth Compared
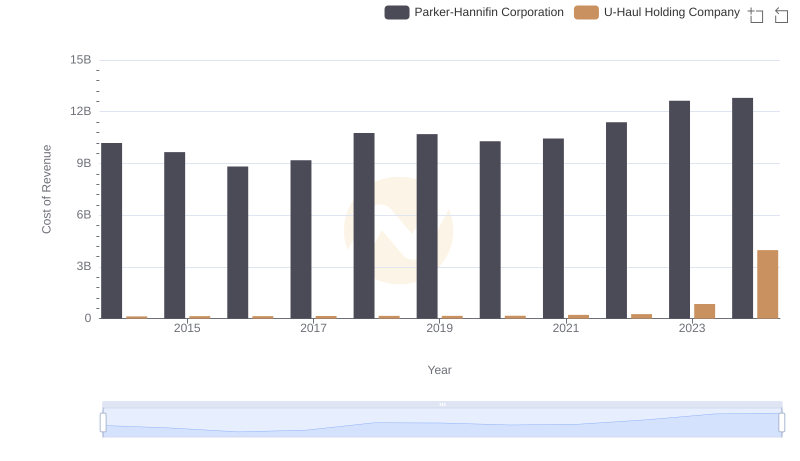
Cost Insights: Breaking Down Parker-Hannifin Corporation and U-Haul Holding Company's Expenses
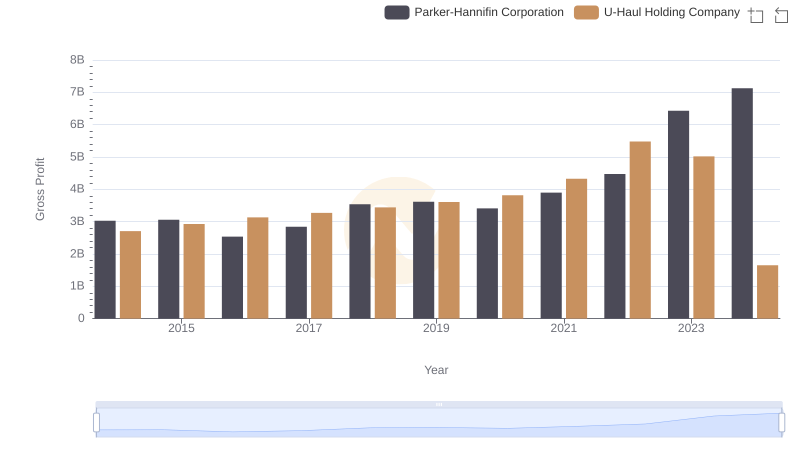
Gross Profit Trends Compared: Parker-Hannifin Corporation vs U-Haul Holding Company
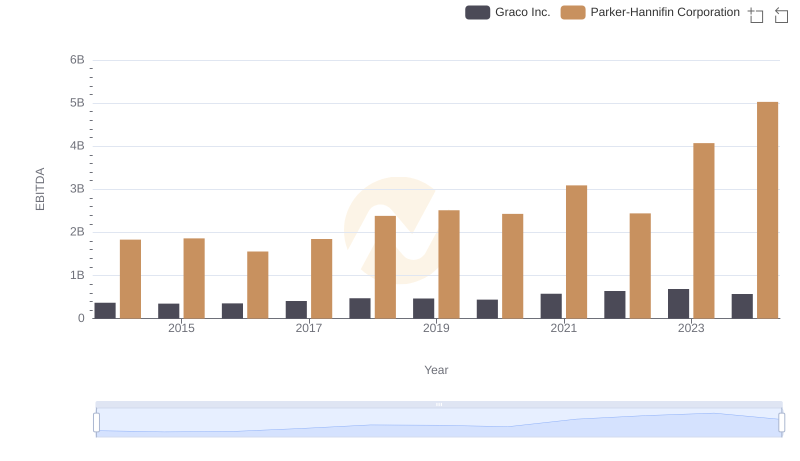
EBITDA Analysis: Evaluating Parker-Hannifin Corporation Against Graco Inc.
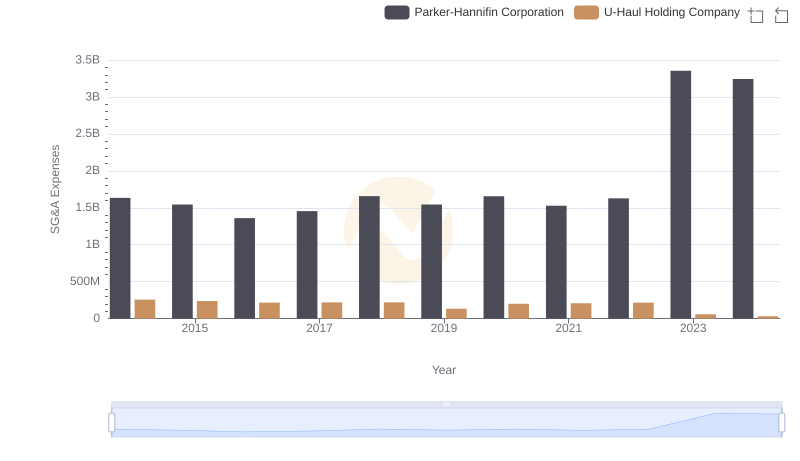
Operational Costs Compared: SG&A Analysis of Parker-Hannifin Corporation and U-Haul Holding Company
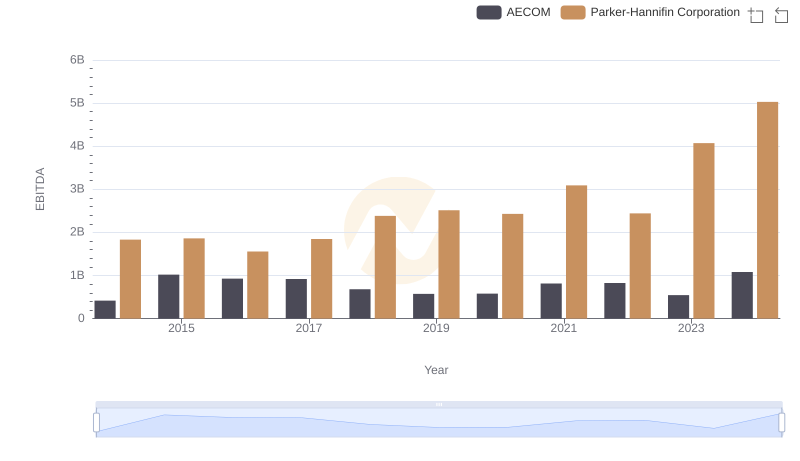
A Professional Review of EBITDA: Parker-Hannifin Corporation Compared to AECOM
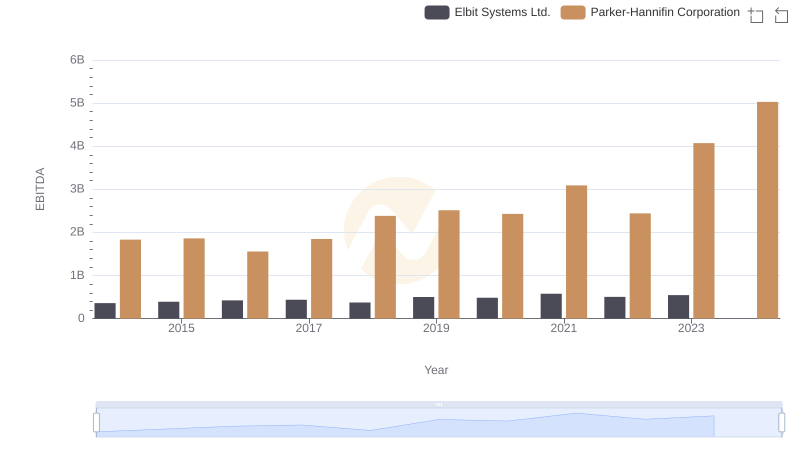
Comprehensive EBITDA Comparison: Parker-Hannifin Corporation vs Elbit Systems Ltd.
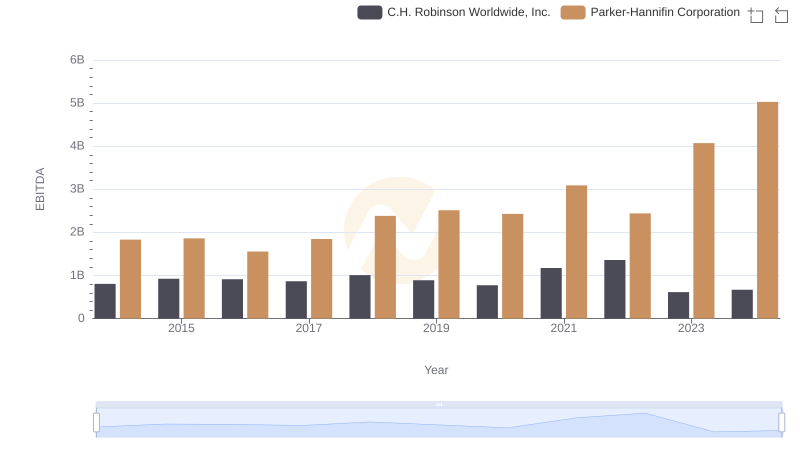
A Side-by-Side Analysis of EBITDA: Parker-Hannifin Corporation and C.H. Robinson Worldwide, Inc.
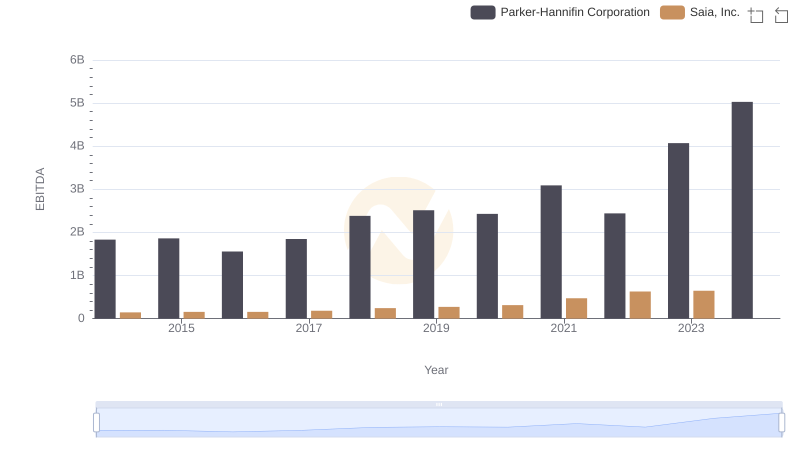
Parker-Hannifin Corporation vs Saia, Inc.: In-Depth EBITDA Performance Comparison
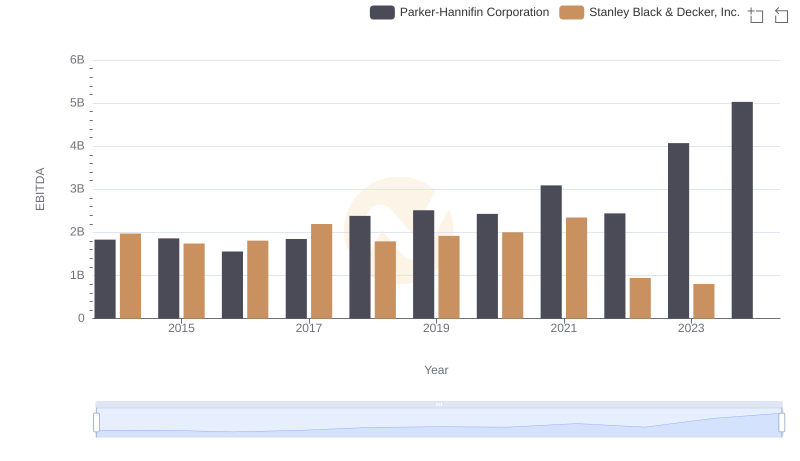
Parker-Hannifin Corporation vs Stanley Black & Decker, Inc.: In-Depth EBITDA Performance Comparison
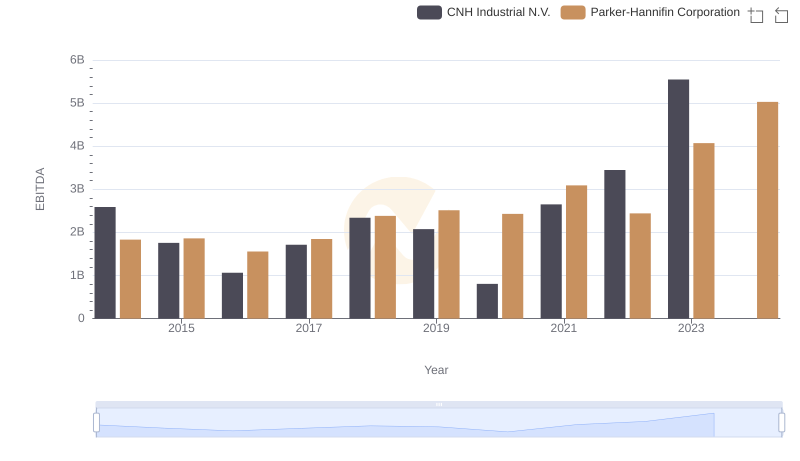
Comprehensive EBITDA Comparison: Parker-Hannifin Corporation vs CNH Industrial N.V.