| __timestamp | Graco Inc. | Parker-Hannifin Corporation |
|---|---|---|
| Wednesday, January 1, 2014 | 369321000 | 1832903000 |
| Thursday, January 1, 2015 | 346732000 | 1861551000 |
| Friday, January 1, 2016 | 354454000 | 1558088000 |
| Sunday, January 1, 2017 | 408879000 | 1846306000 |
| Monday, January 1, 2018 | 472905000 | 2382235000 |
| Tuesday, January 1, 2019 | 466687000 | 2513468000 |
| Wednesday, January 1, 2020 | 440431000 | 2431500000 |
| Friday, January 1, 2021 | 578005000 | 3092383000 |
| Saturday, January 1, 2022 | 641618000 | 2441242000 |
| Sunday, January 1, 2023 | 686593000 | 4071687000 |
| Monday, January 1, 2024 | 570098000 | 5028229000 |
Igniting the spark of knowledge
In the competitive landscape of industrial manufacturing, Parker-Hannifin Corporation and Graco Inc. have shown remarkable financial trajectories over the past decade. From 2014 to 2024, Parker-Hannifin's EBITDA has surged by approximately 175%, peaking in 2024. This growth underscores its robust market strategies and operational efficiencies. In contrast, Graco Inc. has experienced a steady EBITDA increase of around 55% during the same period, reflecting its consistent performance and market presence.
This analysis provides a clear picture of how these industrial giants have navigated economic challenges and capitalized on growth opportunities.
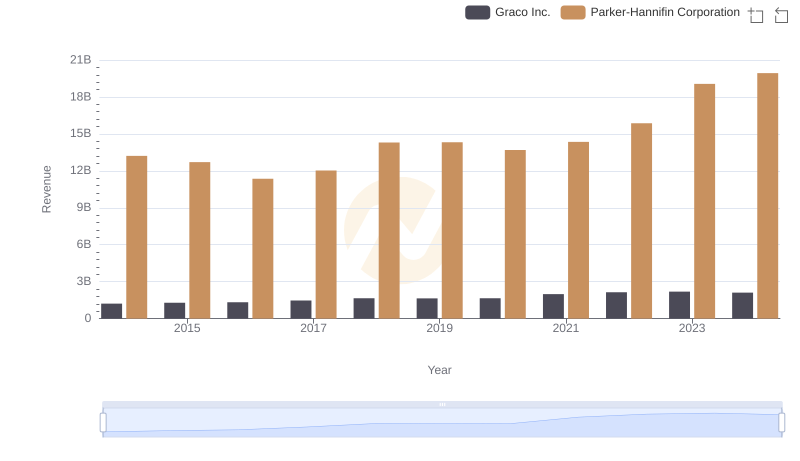
Comparing Revenue Performance: Parker-Hannifin Corporation or Graco Inc.?
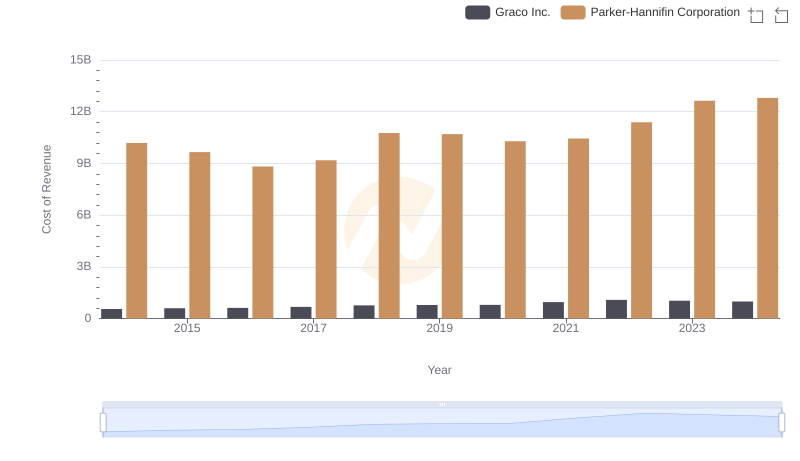
Cost of Revenue: Key Insights for Parker-Hannifin Corporation and Graco Inc.
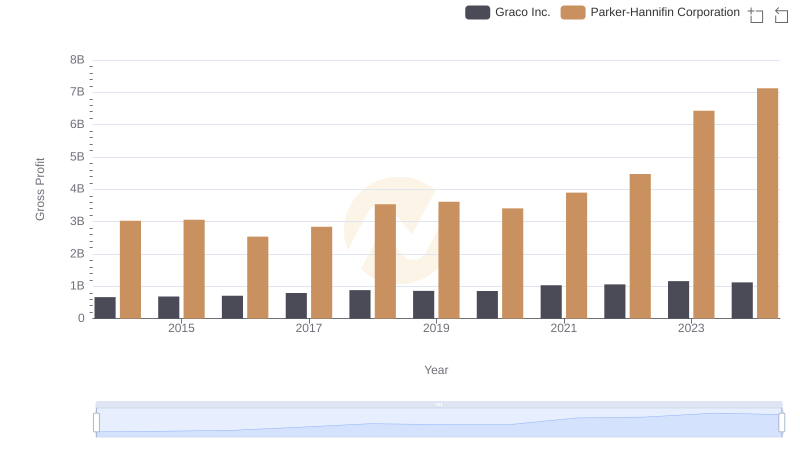
Gross Profit Analysis: Comparing Parker-Hannifin Corporation and Graco Inc.
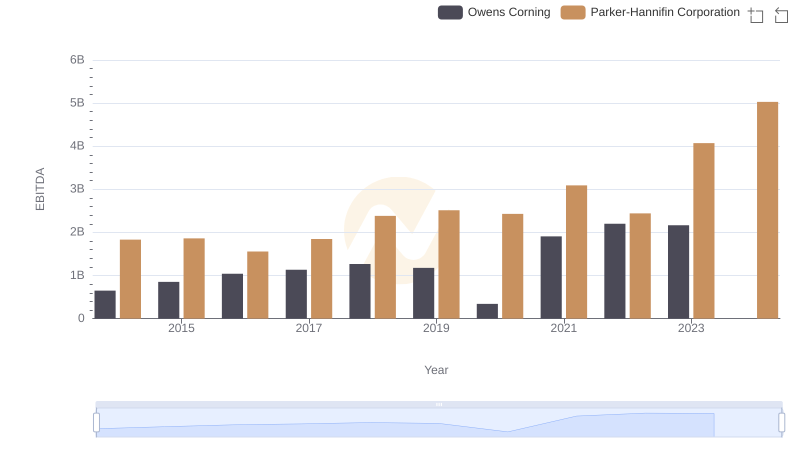
Parker-Hannifin Corporation and Owens Corning: A Detailed Examination of EBITDA Performance
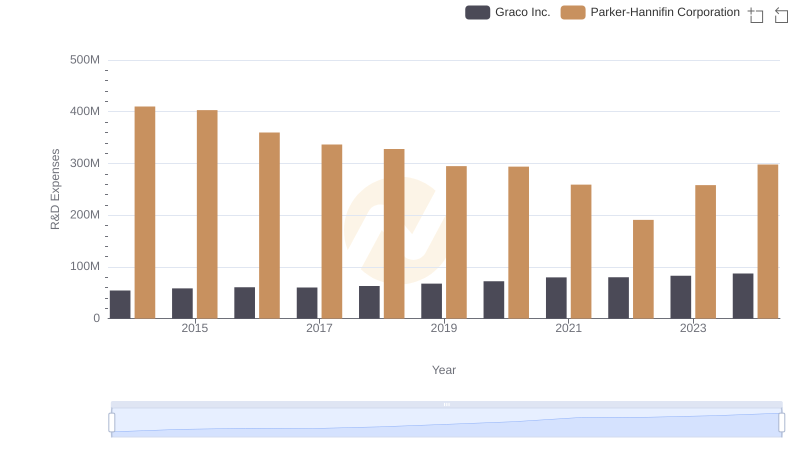
Research and Development Investment: Parker-Hannifin Corporation vs Graco Inc.
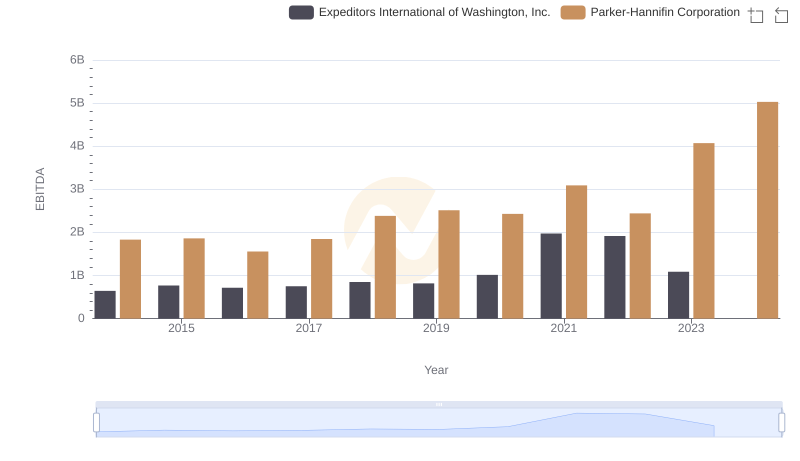
A Professional Review of EBITDA: Parker-Hannifin Corporation Compared to Expeditors International of Washington, Inc.
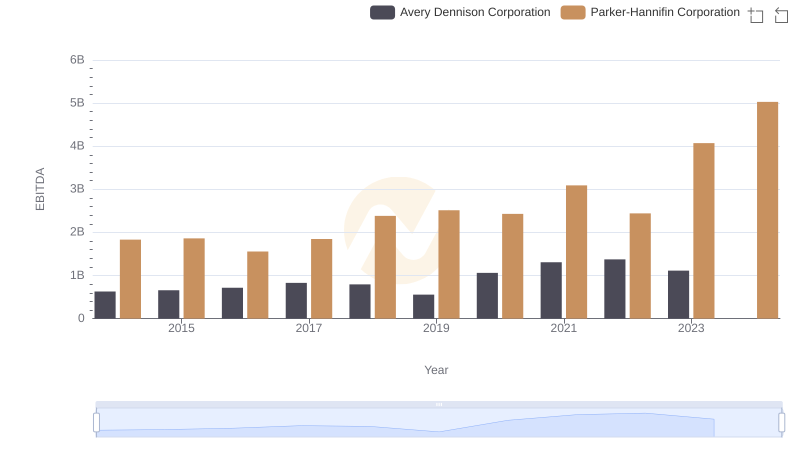
EBITDA Metrics Evaluated: Parker-Hannifin Corporation vs Avery Dennison Corporation
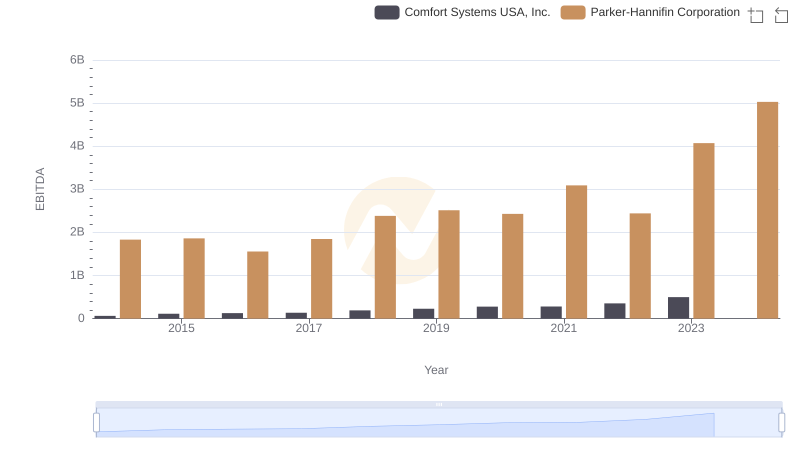
Parker-Hannifin Corporation and Comfort Systems USA, Inc.: A Detailed Examination of EBITDA Performance
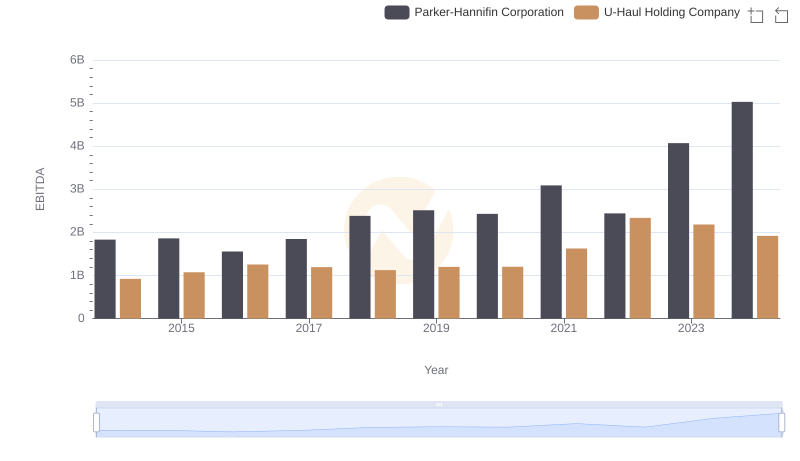
EBITDA Metrics Evaluated: Parker-Hannifin Corporation vs U-Haul Holding Company
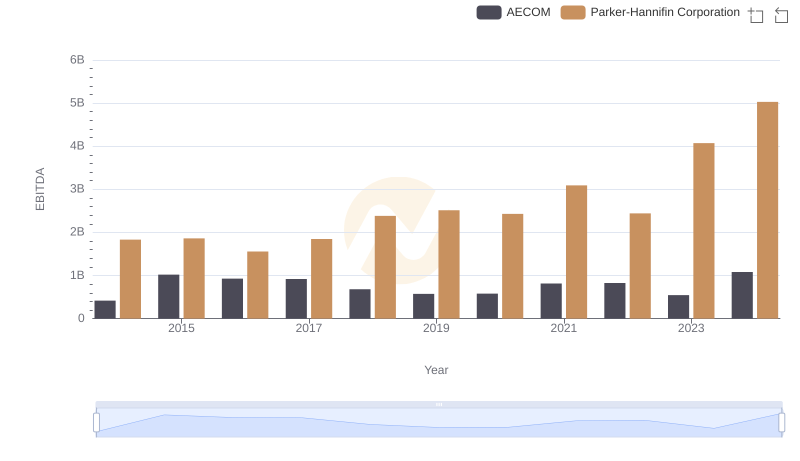
A Professional Review of EBITDA: Parker-Hannifin Corporation Compared to AECOM