| __timestamp | Parker-Hannifin Corporation | Stanley Black & Decker, Inc. |
|---|---|---|
| Wednesday, January 1, 2014 | 1832903000 | 1975400000 |
| Thursday, January 1, 2015 | 1861551000 | 1741900000 |
| Friday, January 1, 2016 | 1558088000 | 1810200000 |
| Sunday, January 1, 2017 | 1846306000 | 2196000000 |
| Monday, January 1, 2018 | 2382235000 | 1791200000 |
| Tuesday, January 1, 2019 | 2513468000 | 1920600000 |
| Wednesday, January 1, 2020 | 2431500000 | 2004200000 |
| Friday, January 1, 2021 | 3092383000 | 2345500000 |
| Saturday, January 1, 2022 | 2441242000 | 942800000 |
| Sunday, January 1, 2023 | 4071687000 | 802700000 |
| Monday, January 1, 2024 | 5028229000 | 286300000 |
In pursuit of knowledge
In the ever-evolving landscape of industrial manufacturing, Parker-Hannifin Corporation and Stanley Black & Decker, Inc. have long been titans. Over the past decade, their EBITDA performance has painted a vivid picture of resilience and adaptation. From 2014 to 2023, Parker-Hannifin's EBITDA surged by an impressive 175%, peaking in 2023, while Stanley Black & Decker faced a decline, with a notable drop of over 50% in 2023 compared to its 2017 high.
This comparison underscores the dynamic nature of the industrial sector and the importance of strategic agility.
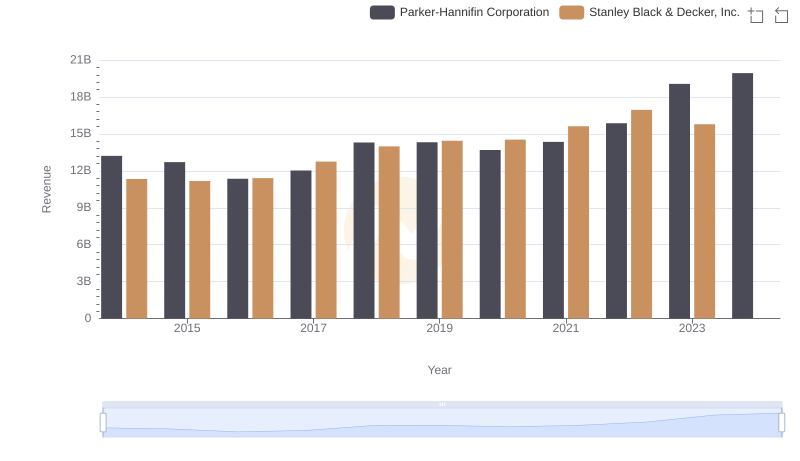
Parker-Hannifin Corporation and Stanley Black & Decker, Inc.: A Comprehensive Revenue Analysis

Cost of Revenue Trends: Parker-Hannifin Corporation vs Stanley Black & Decker, Inc.

Parker-Hannifin Corporation and Stanley Black & Decker, Inc.: A Detailed Gross Profit Analysis

Research and Development Expenses Breakdown: Parker-Hannifin Corporation vs Stanley Black & Decker, Inc.
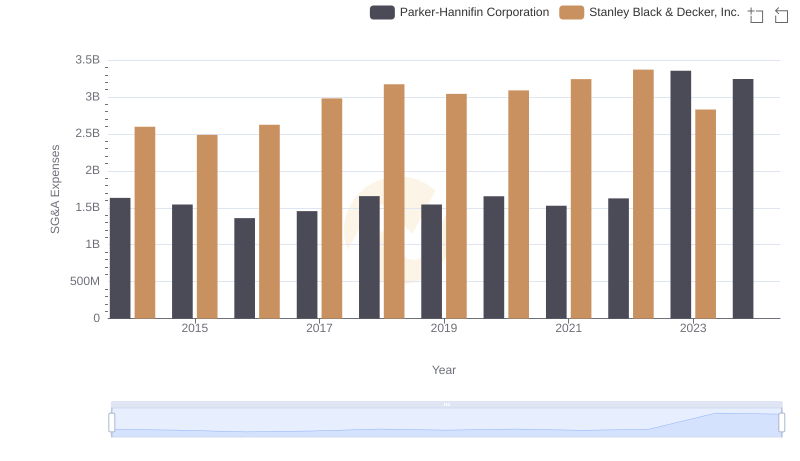
Operational Costs Compared: SG&A Analysis of Parker-Hannifin Corporation and Stanley Black & Decker, Inc.
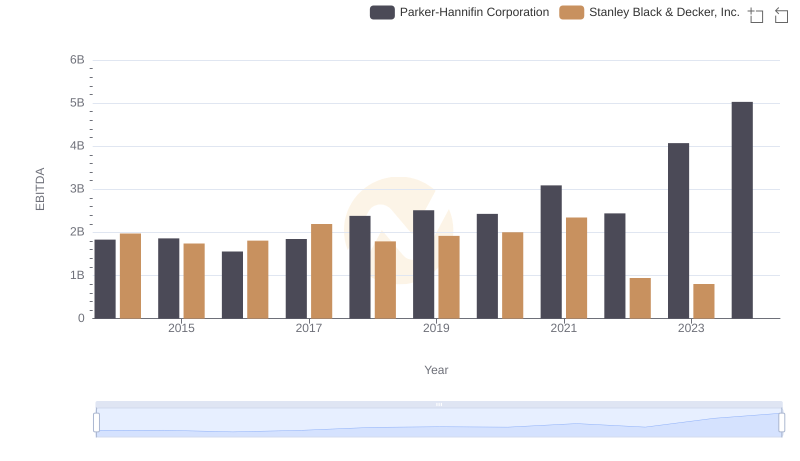
Comparative EBITDA Analysis: Parker-Hannifin Corporation vs Stanley Black & Decker, Inc.

Parker-Hannifin Corporation and Stanley Black & Decker, Inc.: A Comprehensive Revenue Analysis
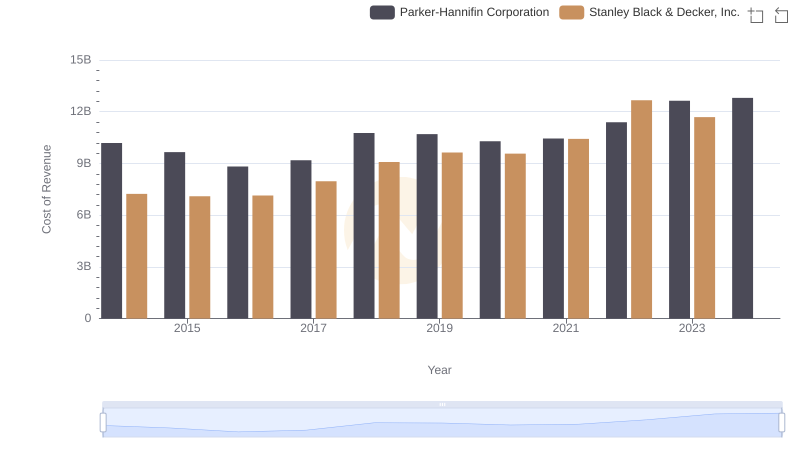
Analyzing Cost of Revenue: Parker-Hannifin Corporation and Stanley Black & Decker, Inc.
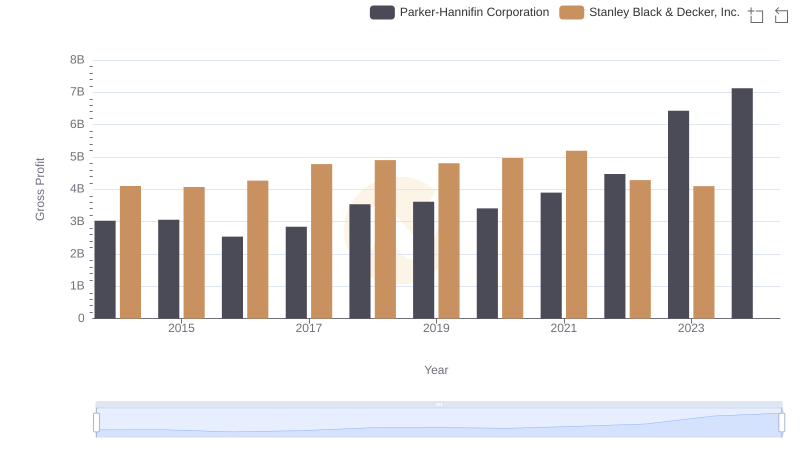
Gross Profit Comparison: Parker-Hannifin Corporation and Stanley Black & Decker, Inc. Trends
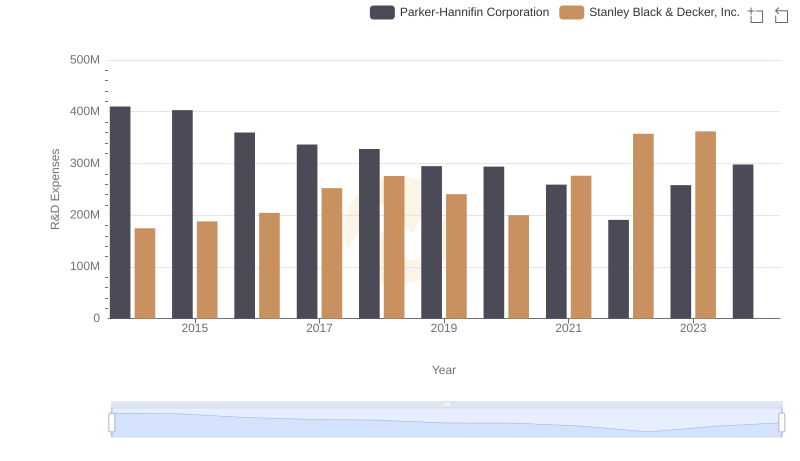
Parker-Hannifin Corporation or Stanley Black & Decker, Inc.: Who Invests More in Innovation?
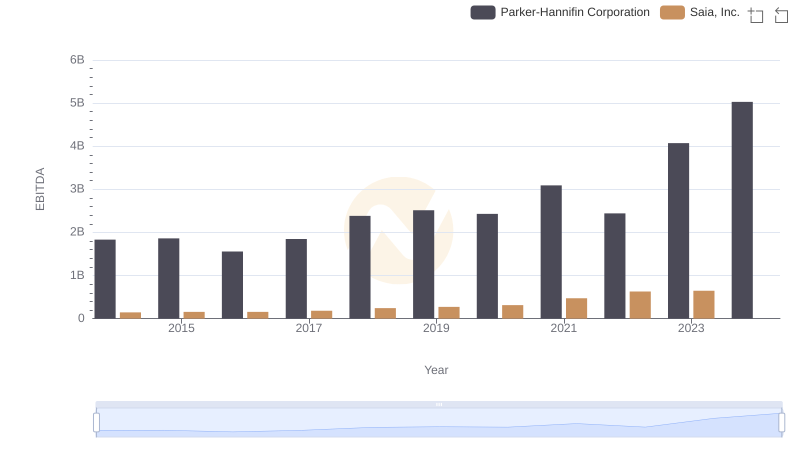
Parker-Hannifin Corporation vs Saia, Inc.: In-Depth EBITDA Performance Comparison